You closed $2.1 million in revenue last year. Heating season was strong — 28% above forecast. Your install crew ran a $42,000 ductwork job in November that you still talk about. But when your accountant pulled the year-end numbers, there was $41,000 sitting in the operating account. Not $41,000 in profit. $41,000 total.
Where did the money go? The answer is buried in a tangle of seasonal cash flow mismatches, technician overtime you didn’t track correctly, parts inventory you expensed when you should have capitalized, and maintenance agreement revenue you recognized in the wrong month. This is why HVAC bookkeeping isn’t something you hand to a general bookkeeper and forget about — the financial patterns in this industry are unlike anything in standard small business accounting.
This guide covers the specific financial management challenges that HVAC contractors between $1M and $10M face. If you already know what a P&L is and you’re past the “shoebox of receipts” stage, this is where you go deeper — into the chart of accounts structure, job costing methodology, payroll complexity, and KPIs that determine whether your company is actually profitable or just busy.
A general bookkeeper can handle your bank reconciliation and categorize expenses. What they can’t do — without HVAC-specific knowledge — is interpret the financial patterns that make or break a contracting business.
HVAC revenue doesn’t arrive in a straight line. A typical contractor in the Mid-Atlantic sees 40-50% of annual revenue concentrated in June through September (cooling season) and November through February (heating season). The shoulder months — March through May and September through October — can see revenue drop 30-60% from peak.
That means your bookkeeper needs to understand that a $80,000 month in April isn’t a crisis if your trailing 12-month average is $175,000. And a $310,000 month in July doesn’t mean you can hire three new techs.
In a single week, your company might complete a $150 diagnostic call, a $3,200 compressor replacement, a $14,000 residential HVAC install, and a $65,000 commercial rooftop unit project. Each of these has a different margin profile, different labor allocation, and different revenue recognition treatment. Your books need to track profitability at the job-type level, not just the company level.
HVAC technicians earn overtime, spiffs, commissions on maintenance agreement sales, and sometimes per-job bonuses. A tech who earns a $50 spiff on a Tuesday changes the overtime calculation for the entire week — and most payroll systems don’t handle that automatically. We’ll cover this in detail below.
Your field service platform (ServiceTitan, Housecall Pro, Jobber) generates invoices, tracks parts, and schedules jobs. But the data that flows into QuickBooks from these systems is only as clean as the mapping between them. Missing line items, miscategorized revenue, and duplicate entries are the norm — not the exception.
Key insight: The difference between an HVAC company that nets 12% and one that nets 4% is rarely about pricing or sales volume. It’s about whether the owner can see, in real time, which jobs are profitable and which are eating margin. That visibility starts with HVAC-specific bookkeeping.
Your chart of accounts is the foundation of every financial report you’ll ever pull. A generic QuickBooks chart of accounts gives you “Sales” and “Cost of Goods Sold.” That tells you nothing about whether your install division is subsidizing money-losing service calls.
Here’s a chart of accounts structure built specifically for HVAC contractors:
| Account Number | Account Name | Type |
|---|---|---|
| 4000 | Revenue | |
| 4100 | Service & Repair Revenue | Income |
| 4200 | Installation Revenue — Residential | Income |
| 4250 | Installation Revenue — Commercial | Income |
| 4300 | Maintenance Agreement Revenue | Income |
| 4400 | Warranty Work Revenue | Income |
| 4500 | Indoor Air Quality / Accessories Revenue | Income |
| 5000 | Cost of Goods Sold | |
| 5100 | Technician Labor — Direct (Service) | COGS |
| 5150 | Installer Labor — Direct (Installs) | COGS |
| 5200 | Materials & Parts | COGS |
| 5250 | Equipment (Condensers, Air Handlers, Furnaces) | COGS |
| 5300 | Subcontractor Costs | COGS |
| 5400 | Equipment Rental | COGS |
| 5500 | Permit Fees | COGS |
| 6000 | Operating Expenses | |
| 6100 | Fleet Costs (Fuel, Maintenance, Payments) | Expense |
| 6200 | General Liability & Workers’ Comp Insurance | Expense |
| 6300 | Licensing & Continuing Education | Expense |
| 6400 | Shop / Warehouse Rent & Utilities | Expense |
| 6500 | Office & Administrative Salaries | Expense |
| 6600 | Marketing & Advertising | Expense |
| 6700 | Warranty Reserve | Expense |
| 6800 | Tools & Small Equipment (under $2,500) | Expense |
| 6900 | Software & Subscriptions | Expense |
The critical split: Separating revenue by service type (4100-4500) and labor by division (5100 vs 5150) is what allows you to calculate gross margin by department. Without this, you’re flying blind on whether your install team or your service team is carrying the company.
Warranty reserve (6700): Set aside 1-2% of job revenue into a warranty reserve fund each month. When a compressor you installed fails 11 months later, the labor and parts to fix it come from this reserve — not from current-month operating cash. Most HVAC contractors skip this and then wonder why Q1 margins are terrible (because they’re absorbing all the warranty callbacks from last year’s installs).
Job costing is where HVAC bookkeeping separates the profitable companies from the ones that are just busy. You need to know, at the individual job level, whether you made money or lost money — and aggregate that data by service type to identify systemic margin problems.
A residential diagnostic call priced at $150:
| Cost Component | Amount |
|---|---|
| Technician time: 1.5 hrs at $30/hr | $45.00 |
| Burden (benefits, taxes, WC): 40% | $18.00 |
| Truck roll (fuel, insurance, depreciation) | $28.00 |
| Parts used (capacitor) | $22.00 |
| Dispatching & admin overhead allocation | $35.00 |
| Warranty callback risk (2%) | $3.00 |
| Total job cost | $151.00 |
| Gross margin | -$1.00 (-0.7%) |
You charged $150 and it cost you $151 to show up. This is common on basic diagnostic calls where the tech replaces a minor part and doesn’t upsell a repair or maintenance agreement. The call is a loss leader — which is fine, as long as you know it’s a loss leader and your conversion rate to larger repairs or agreements covers the gap.
A residential HVAC system replacement priced at $12,500:
| Cost Component | Amount |
|---|---|
| Install crew labor: 2 techs × 8 hrs × $30/hr | $480.00 |
| Burden (40%) | $192.00 |
| Equipment (condenser + air handler + thermostat) | $4,800.00 |
| Materials (line set, pad, disconnect, ductwork mods) | $620.00 |
| Subcontractor (electrician panel upgrade) | $450.00 |
| Permit fees | $175.00 |
| Overhead allocation (12% of revenue) | $1,500.00 |
| Warranty reserve (2%) | $250.00 |
| Total job cost | $8,467.00 |
| Gross margin | $4,033.00 (32.3%) |
A 32% margin on installs is solid — it falls right in the industry target range of 35-50% for installations. But notice how the margin picture changes dramatically if the install takes 12 hours instead of 8 (adding $180 in labor + burden) or if the electrician bills $750 instead of $450. Job costing at this granularity is what lets you catch those overruns before they become a pattern.
For a deeper dive into setting up job costing in your field service software and QuickBooks, see our guide on HVAC Job Costing: How to Know Which Jobs Actually Make You Money.
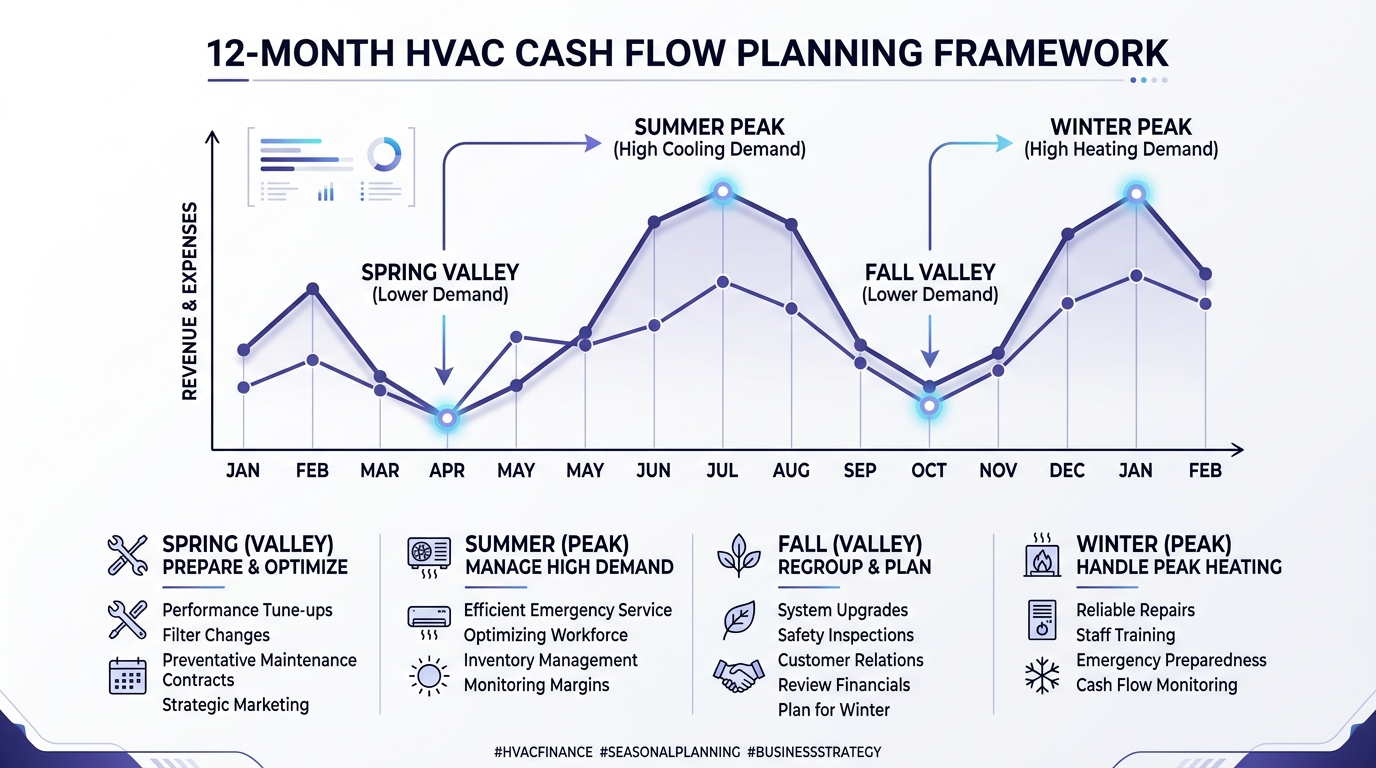
Cash flow kills more HVAC companies than bad pricing. The seasonal revenue pattern creates a structural timing mismatch that requires active management — you can’t just deposit checks and hope for the best.
Here’s what a typical HVAC contractor’s revenue curve looks like, and what it means for cash management:
Peak months (Jun-Aug, Dec-Feb): Revenue surges 40-60% above average. The temptation is to spend — hire new techs, buy new trucks, upgrade equipment. Resist. Peak revenue is paying for the valley months that are coming.
Valley months (Mar-May, Sep-Oct): Revenue drops 30-60% from peak. Fixed costs — rent, insurance, truck payments, base payroll — don’t drop at all. This is where undisciplined companies burn through their reserves and start floating payroll on credit lines.
Pre-season purchasing (Apr-May, Sep-Oct): You need to buy equipment inventory before the season hits — condensers in April for summer installs, furnaces in September for heating season. That means your cash is going out during the exact months when revenue is at its lowest.
The SBA recommends that seasonal businesses maintain 3-6 months of operating expenses as a cash reserve. For an HVAC company running $80,000/month in fixed costs, that’s $240,000-$480,000 in liquid reserves. That sounds aggressive — until you hit an April where you’ve bought $120,000 in condensers and your revenue is $95,000.
Maintenance agreements now represent 55% of HVAC services revenue and the segment is growing at 8.3% annually. From a cash flow perspective, maintenance agreements are the single best tool you have for smoothing seasonal volatility.
A contract base of 400 agreements at $200/year generates $80,000 in predictable annual revenue — $6,667/month, every month, regardless of weather. That covers a significant portion of your fixed costs during valley months. Your bookkeeper should track maintenance agreement revenue separately from on-demand service revenue so you can see exactly how much of your floor is covered.
Technician payroll is where most HVAC companies have the biggest gap between what they think they’re paying and what they’re actually paying. The complexity comes from three overlapping requirements that most payroll systems don’t handle cleanly.
HVAC technicians are non-exempt under FLSA in virtually all cases. The “skilled computer professional” and “administrative” exemptions don’t apply to field technicians. That means overtime at 1.5x kicks in after 40 hours in a workweek — and during peak season, your best techs are routinely hitting 50-60 hours.
At a $30/hour base rate, the overtime premium on a 55-hour week adds $225 in extra labor cost. Scale that across 8 technicians for 16 peak weeks, and you’re looking at $28,800 in overtime that many HVAC owners don’t budget for.
Here’s a payroll trap that catches nearly every HVAC contractor: when a technician earns a spiff (a per-job bonus for selling a maintenance agreement or upselling a repair), that spiff must be allocated back to the week it was earned for overtime calculation purposes. This is ACCA (Air Conditioning Contractors of America) guidance aligned with FLSA requirements.
Example: A tech works 50 hours and earns a $100 spiff that week. The spiff increases the regular rate from $30.00/hr to $32.00/hr ($1,600 base + $100 spiff / 50 hours = $34.00 weighted rate). The overtime premium recalculates from $15.00 to $17.00 per OT hour. On 10 overtime hours, that’s an extra $20 in overtime that most payroll systems miss.
Get this wrong consistently across your team and you’re building an unpaid wage liability that can trigger a Department of Labor audit with back-pay penalties.
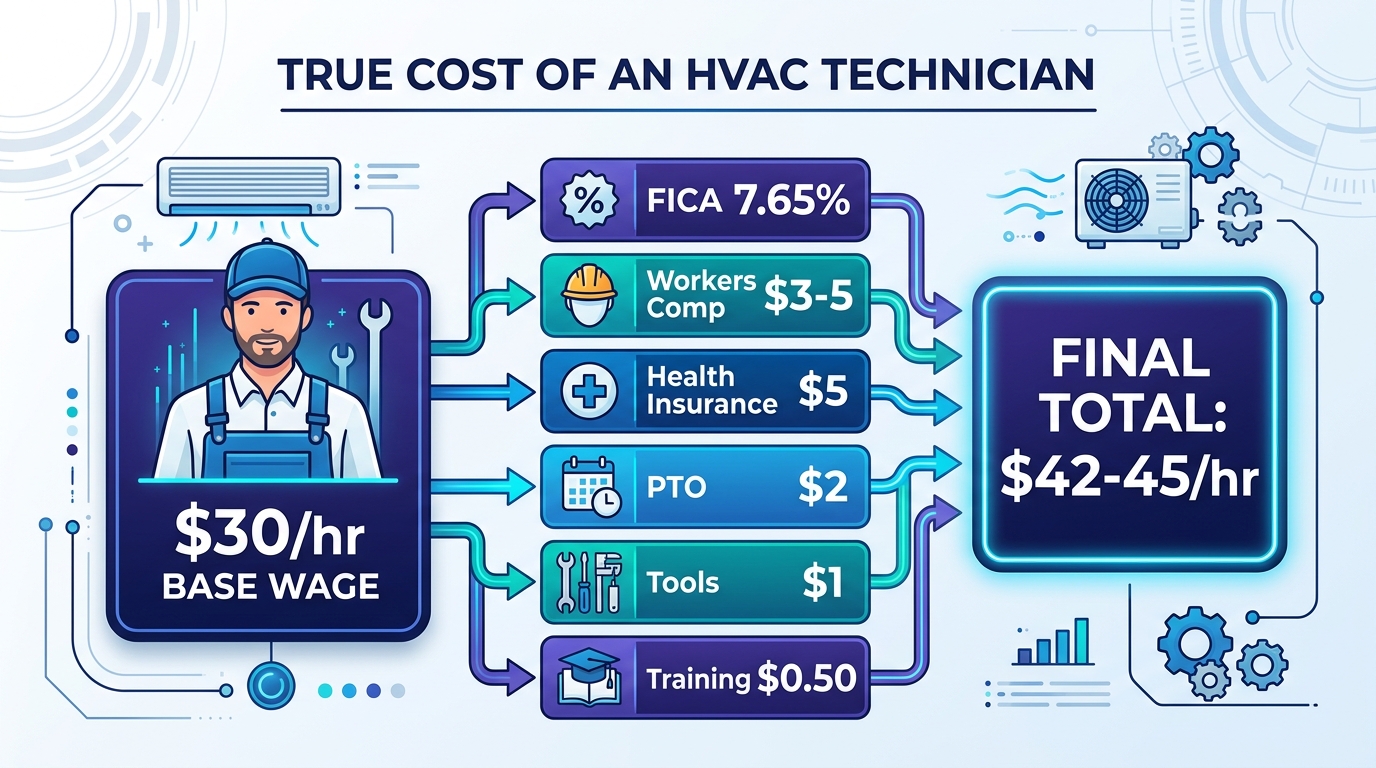
The median HVAC technician wage is $59,810/year (BLS, May 2024), which works out to roughly $28.75/hour. But the cost to employ that technician is substantially higher.
Burden rate calculation on a $30/hour base rate:
| Component | Cost | % of Base |
|---|---|---|
| Base wage | $30.00/hr | — |
| FICA (employer share) | $2.30/hr | 7.65% |
| Federal & state unemployment | $0.45/hr | 1.5% |
| Workers’ compensation (HVAC class) | $2.70/hr | 9.0% |
| Health insurance ($600/mo ÷ 173 hrs) | $3.47/hr | 11.6% |
| Paid time off (2 weeks) | $1.15/hr | 3.8% |
| Training & certifications (EPA 608, NATE) | $0.60/hr | 2.0% |
| Uniforms, tools, phone | $0.45/hr | 1.5% |
| Loaded cost | $41.12 – $45.00/hr | 37-50% |
Your true cost per tech hour is $42-45 on a $30 base — a 25-40% burden rate depending on your benefits package and workers’ comp classification. If you’re costing jobs using the base wage, every margin calculation you’ve ever run is wrong.
HVAC contractors are capital-intensive businesses. Between service trucks, diagnostic equipment, recovery machines, and shop tools, you’re making significant equipment purchases every year. How you expense these purchases has a major impact on your tax liability.
The Section 179 deduction allows you to expense up to $2,560,000 in qualifying equipment purchases in the year you place them in service, rather than depreciating them over 5-7 years.
For HVAC contractors, qualifying purchases include:
This is where HVAC contractors get tripped up:
Most HVAC service vans fall above the 6,000 lb threshold, but verify the GVWR on the door sticker before assuming. A Ford Transit 150 (low roof, short wheelbase) comes in under 6,000 lbs — which means a $45,000 van gives you a $20,400 deduction instead of a $45,000 deduction. That difference is worth knowing before you sign the purchase order.
Following the passage of the OBBBA (One Big Beautiful Bill Act), 100% bonus depreciation has been restored for qualifying assets placed in service in 2026. This means you can deduct the full cost of eligible new and used equipment in the year of purchase — even beyond the Section 179 limit. For HVAC contractors making large fleet or equipment purchases, this is a significant tax planning opportunity.
Tools and small equipment under $2,500 per item can be expensed immediately under the de minimis safe harbor election. This covers most hand tools, meters, and portable equipment that technicians carry on their trucks. Make the election on your tax return annually and you avoid tracking dozens of small-asset depreciation schedules.
Maintenance agreements are the fastest-growing revenue segment in HVAC — 55% of services revenue and growing at 8.3% annually. But how you recognize that revenue on your books matters more than most contractors realize.
Under ASC 606 (Revenue from Contracts with Customers), you recognize revenue when you satisfy a performance obligation — meaning when you deliver the service, not when the customer pays.
For a $240/year maintenance agreement that includes two tune-ups (spring and fall) and priority service:
If you sell 200 maintenance agreements in September during your fall marketing push, that’s $48,000 in cash collected. Under immediate recognition, your September P&L shows $48,000 in maintenance revenue — and January shows nearly zero.
Under straight-line recognition, September shows $4,000 (one month of 200 agreements) and you carry $44,000 as deferred revenue on the balance sheet, recognizing $4,000/month over the contract term. That gives you an accurate picture of monthly profitability and prevents you from spending cash you haven’t earned yet.
Your bookkeeper needs to maintain a deferred revenue schedule — tracking each agreement’s start date, term, total value, and monthly recognition amount. This is one of the areas where HVAC-specific bookkeeping knowledge pays for itself.
The integration between your field service platform and QuickBooks Online is the single biggest source of bookkeeping errors for HVAC contractors. Here’s what you need to know about the three most common platforms.
ServiceTitan is the market leader for mid-to-large HVAC companies. It exports to QuickBooks via automated journal entries — summarized daily or weekly, not at the individual invoice level. This means your bookkeeper sees a lump-sum debit to Accounts Receivable and credits to various revenue accounts. The mapping between ServiceTitan revenue categories and your QuickBooks chart of accounts must be configured correctly at setup, or every journal entry will be miscategorized.
What your bookkeeper needs from you: Access to ServiceTitan reports to verify the journal entry totals match the source data. Discrepancies between the two systems should be reconciled monthly, not quarterly.
Housecall Pro offers a two-way sync with QuickBooks Online. Invoices created in Housecall Pro flow into QuickBooks as individual transactions. This gives your bookkeeper more granularity than ServiceTitan’s summary approach, but it also means more transactions to review — and more opportunities for sync errors (duplicate invoices, incorrect customer matching).
Jobber syncs with QuickBooks but has known issues with line item mapping. Specifically, line item details can drop during sync, leaving your bookkeeper with a lump-sum invoice in QuickBooks that doesn’t match the itemized invoice in Jobber. If you’re on Jobber, your bookkeeper needs to spot-check invoice details weekly until you’re confident the sync is reliable.
For a detailed comparison of each platform’s QuickBooks integration — including setup walkthroughs and workarounds for known bugs — see our guide on HVAC Software Integration: Getting Clean Data Into QuickBooks.
What your bookkeeper needs from you: Login access (read-only is fine) to your field service platform. Without it, they’re reconciling blind — matching bank deposits to QuickBooks entries without being able to verify against the source invoices. This is how errors compound.
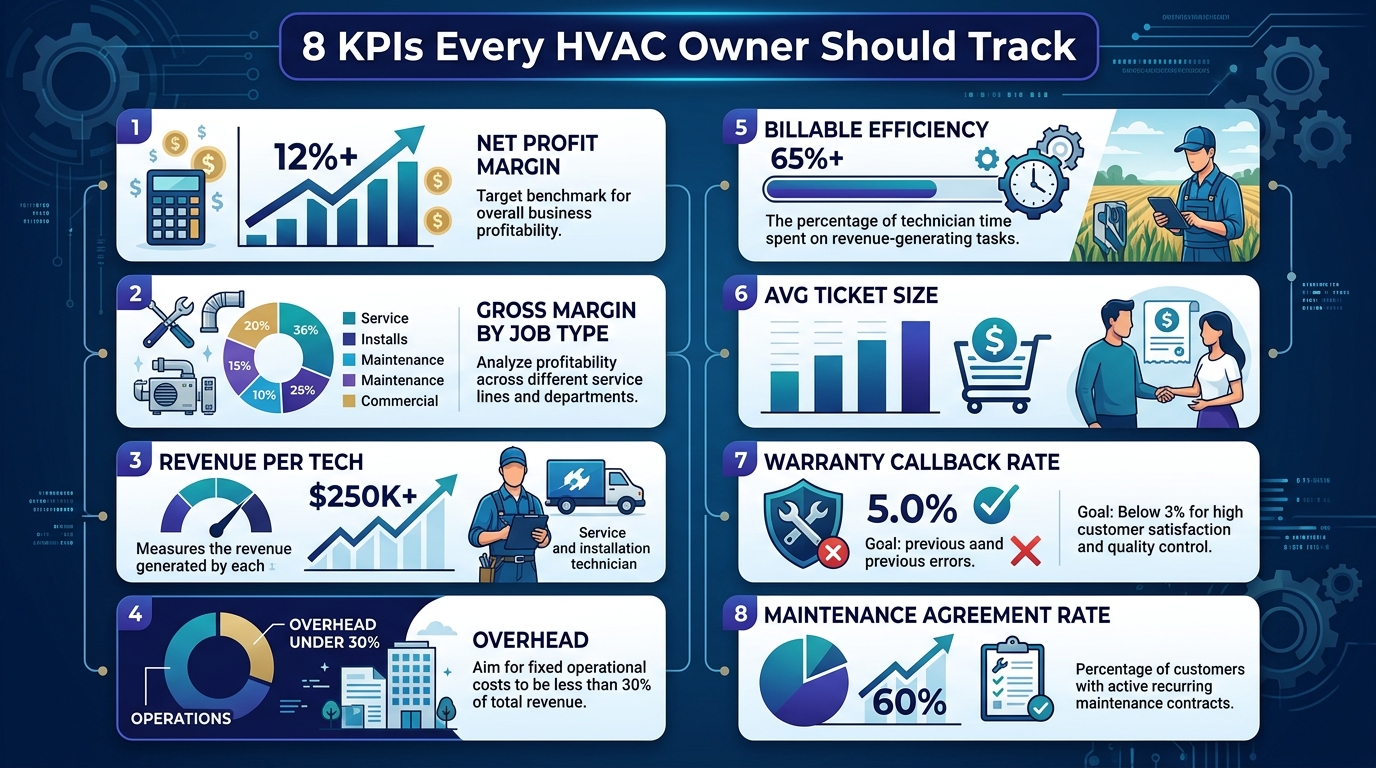
Financial KPIs tell you whether your HVAC bookkeeping is producing actionable data or just compliance paperwork. Track these monthly — not quarterly, not annually.
| KPI | Target | Why It Matters |
|---|---|---|
| Net profit margin | 12%+ (DOE/ACCA benchmark) | Below 8% means you’re one bad season from trouble |
| Gross margin — Service/Repair | 50-65% | Your highest-margin work; subsidizes lower-margin installs |
| Gross margin — Maintenance | 40-60% | Should be rising as agreement base grows |
| Gross margin — Installations | 35-50% | Equipment cost is the biggest variable |
| Revenue per technician | $150K-$250K (avg); $250K-$450K (well-run) | Below $150K signals scheduling or pricing problems |
| Overhead percentage | Under 30% | Above 35% means you’re top-heavy |
| Billable efficiency | 75-85% | Hours billed vs hours paid; below 70% is a dispatch problem |
| Average ticket size | Varies by market | Track the trend — flat or declining means techs aren’t presenting options |
| Warranty callback rate | Under 3% | Above 5% means install quality or equipment selection issues |
| Maintenance agreement attachment rate | 40%+ of service calls | Your best tool for stabilizing revenue and building company value |
Revenue per technician deserves special attention. If you’re running 8 technicians and total service revenue is $1M, that’s $125,000 per tech — below the $150K minimum. Either you have too many techs, your pricing is too low, or your dispatch efficiency is poor. Well-run HVAC companies push this number above $250,000 per tech through optimized routing, proper call booking, and strong option-selling by technicians.
Net profit margin at 12% is the DOE/ACCA benchmark for a healthy HVAC contractor. On $2M in revenue, that’s $240,000 in net profit. If you’re netting 5-6%, you’re leaving $120,000-$140,000 on the table annually — and the gap is almost always traceable to job costing failures, uncontrolled overhead, or payroll errors that your bookkeeping system should be catching.
There’s a point in every HVAC company’s growth where the owner (or the office manager wearing six hats) can no longer keep up with the financial complexity. Here are the signs.
| Factor | In-House Bookkeeper | Outsourced HVAC Bookkeeper |
|---|---|---|
| Annual cost | $45,000-$65,000 salary | $12,000-$48,000 ($1K-$4K/mo) |
| Burden (benefits, taxes, WC) | Add 30-40% ($13,500-$26,000) | Included |
| Software & training | $2,000-$5,000/yr | Included |
| Total annual cost | $60,500-$96,000 | $12,000-$48,000 |
| HVAC industry expertise | Unlikely without specific experience | Built into the service |
| Coverage during vacation/illness | None (or you do it yourself) | Continuous |
| Scalability | Hire another person | Adjust scope |
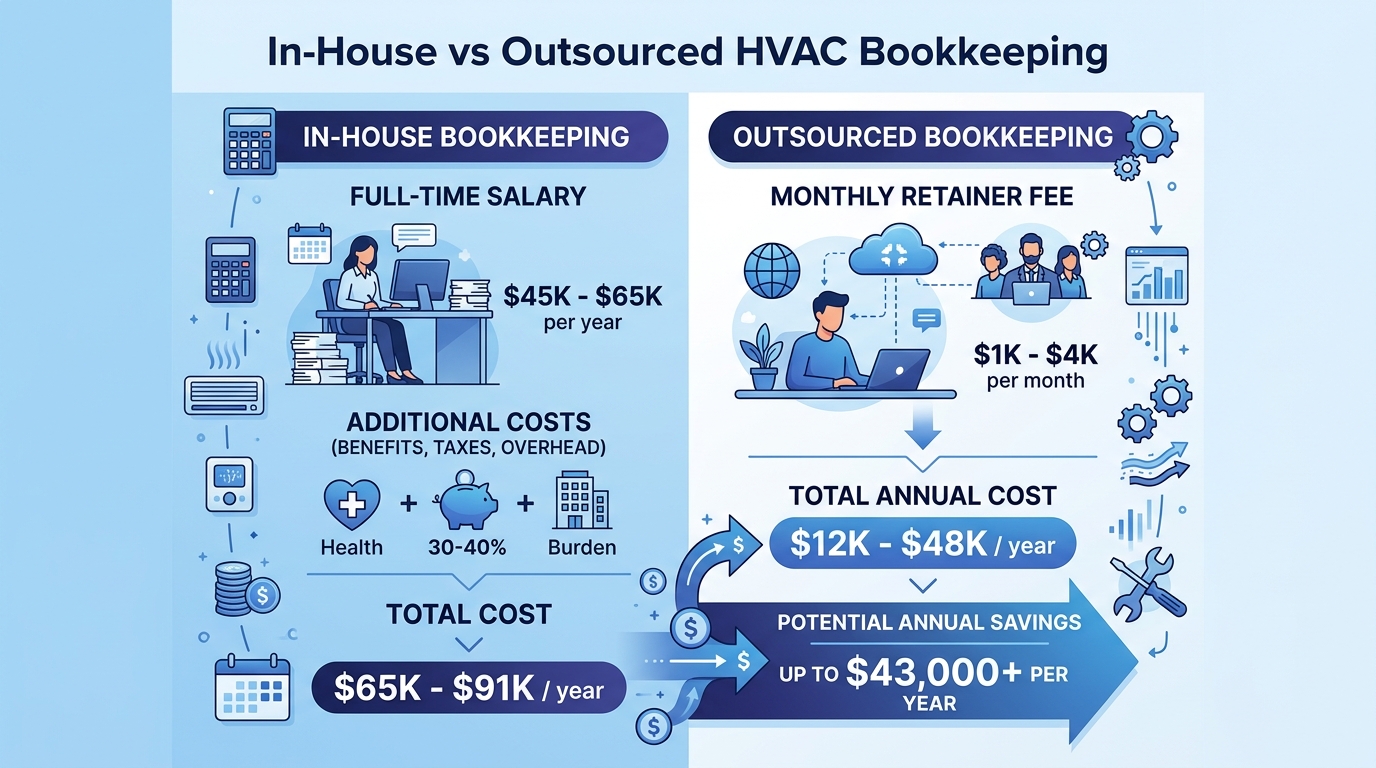
For most HVAC companies between $1M and $5M in revenue, outsourced bookkeeping runs $1,500-$3,000/month — a fraction of the fully loaded cost of a full-time hire. And you’re getting someone who already understands job costing, seasonal cash flow patterns, and technician payroll rules. No training period, no learning curve on HVAC-specific financial management.
What to look for in a specialist: Ask whether they’ve worked with your field service platform before. Ask how they handle maintenance agreement deferred revenue. Ask if they understand spiff overtime recalculation. If they look at you blankly on any of these, they’re a general bookkeeper — not an HVAC bookkeeper. Check out our HVAC bookkeeping services to see what specialized support looks like.
Your HVAC company is a financial engine with a lot of moving parts — seasonal cash surges, capital-intensive equipment purchases, complex payroll, deferred revenue, and margin profiles that vary wildly by job type. Generic bookkeeping treats all of this as noise. HVAC-specific bookkeeping treats it as signal — the data you need to make decisions about pricing, hiring, fleet expansion, and when to push maintenance agreements vs. installs.
Get the books right, and the business decisions get easier. Get them wrong, and you’ll keep asking why there’s no money in the account after your best season. If you want a quick sense of what specialized bookkeeping would cost for your HVAC company, try our instant quote tool — it takes about 60 seconds.
Ready to get your HVAC books right? Steph’s Books specializes in bookkeeping for HVAC contractors. Get an instant quote or schedule a free consultation to see how we can help.
Answer a few quick questions for an instant, no-obligation quote — no sales call required. See how Steph's Books saves you 40-60% vs. hiring in-house.