Most HVAC contractors know exactly when the phone starts ringing and when it goes quiet. What they don’t have is a financial plan that accounts for those swings before they hit the bank account. HVAC seasonal cash flow is the single biggest operational risk for contractors between $1M and $10M in revenue — and the ones who manage it proactively are the ones who survive long enough to grow past it.
For the full picture of HVAC financial management, see our complete guide to HVAC bookkeeping.
Here’s the reality: a typical $2M HVAC company can see monthly revenue swing from $250,000 in July to $85,000 in October. That’s a 66% drop in 90 days — while your payroll, rent, insurance, and truck payments stay exactly the same. If you don’t have a month-by-month cash flow plan, you’re making critical financial decisions reactively. This guide gives you the framework to stop doing that.
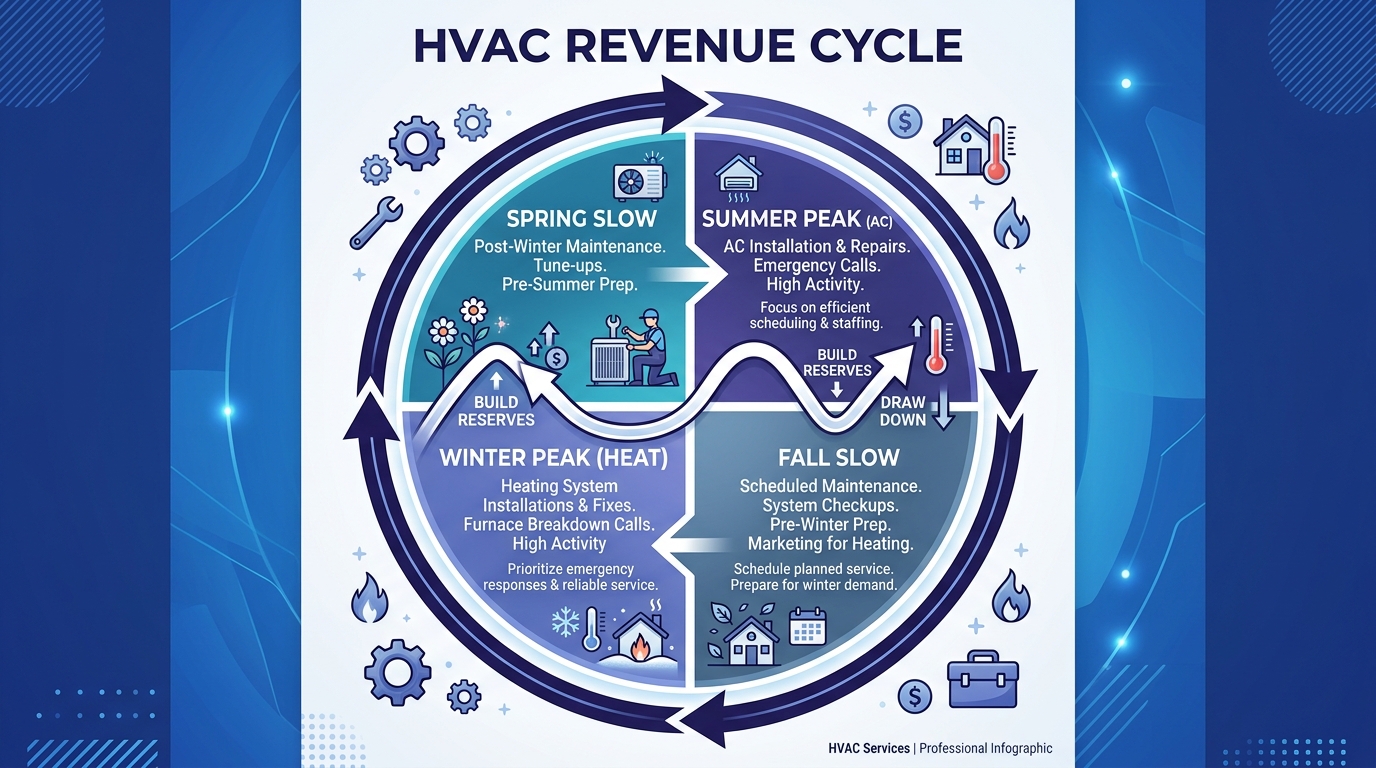
Every market is slightly different, but the underlying revenue pattern for residential and light commercial HVAC contractors follows a predictable cycle. Understanding this cycle is the first step toward managing it. Here’s what a typical $2M HVAC company looks like across 12 months:
| Month | Revenue | % of Annual | Season | Cash Flow Note |
|---|---|---|---|---|
| January | $175,000 | 8.8% | Heating peak | Strong — furnace replacements, emergency calls |
| February | $185,000 | 9.3% | Heating peak | Highest heating month in most markets |
| March | $120,000 | 6.0% | Spring dead zone | Drop begins — heating demand fades |
| April | $100,000 | 5.0% | Spring dead zone | Lowest demand period starts |
| May | $130,000 | 6.5% | Pre-summer ramp | AC tune-ups begin, maintenance agreements |
| June | $210,000 | 10.5% | AC peak | Cooling demand surges |
| July | $250,000 | 12.5% | AC peak | Highest revenue month — emergency AC calls |
| August | $230,000 | 11.5% | AC peak | Strong but tapering toward Labor Day |
| September | $130,000 | 6.5% | Fall dead zone | Sharp drop after summer ends |
| October | $85,000 | 4.3% | Fall dead zone | Lowest revenue month for most contractors |
| November | $160,000 | 8.0% | Heating ramp | Furnace season begins, tune-up demand |
| December | $175,000 | 8.8% | Heating peak | Emergency heating calls, boiler work |
| Total | $1,950,000 | 100% |
The two danger zones are March-April and September-October. These shoulder seasons produce 15-20% of annual revenue but span a full third of the year. Your fixed costs don’t adjust to match.
Key insight: The gap between your highest month (July at $250K) and lowest month (October at $85K) is $165,000. That’s roughly 3 months of payroll for a 10-person HVAC company. If you don’t plan for this delta, you’ll be borrowing against future earnings every fall.
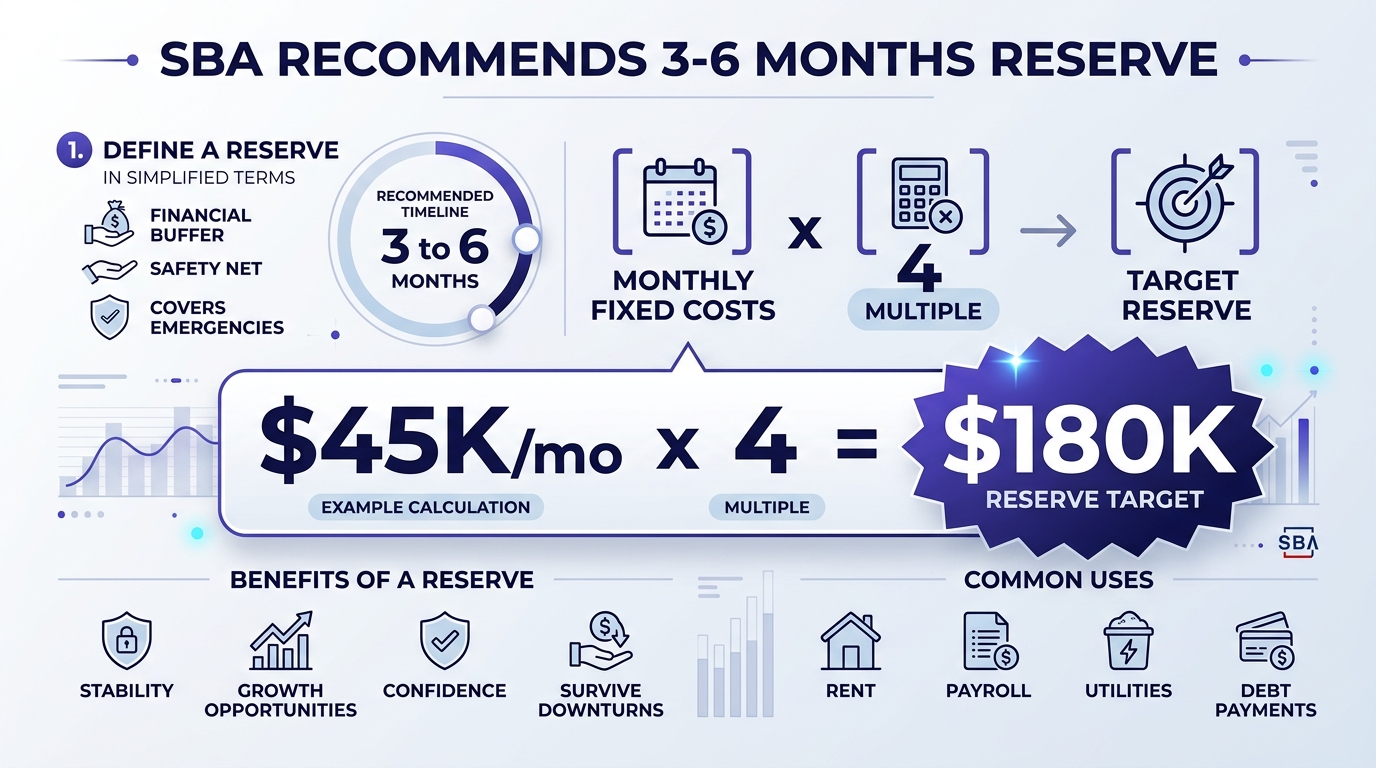
The SBA recommends that small businesses maintain 3 to 6 months of operating expenses in cash reserves. For HVAC contractors, aim for the higher end. Seasonal businesses face more volatility than service firms with recurring monthly revenue, and you need a buffer that covers both the expected dip and the unexpected — a truck engine that blows in September, a workers’ comp audit that lands in April.
For a $2M HVAC company with $110,000/month in fixed overhead (rent, insurance, payroll, vehicle payments), that means a target reserve of $330,000 to $660,000. That sounds enormous. Here’s how to build it without starving current operations.
During your four strongest months (June through August plus February), set aside a fixed percentage of gross revenue into a separate operating reserve account — not your main checking account. Start at 10% and increase to 15% as the reserve grows.
| Month | Revenue | 12% Skim | Reserve Balance |
|---|---|---|---|
| June (Year 1) | $210,000 | $25,200 | $25,200 |
| July | $250,000 | $30,000 | $55,200 |
| August | $230,000 | $27,600 | $82,800 |
| February (Year 2) | $185,000 | $22,200 | $105,000 |
At 12% of peak-month revenue, you accumulate $105,000 in your first cycle — nearly one month of total operating costs. By the end of year two, you’re approaching the 3-month floor. By year three, you hit the SBA target.
The key discipline: Don’t touch the reserve during peak months. It exists for October, not for a new install truck in July. Keep it in a high-yield business savings account (most pay 4-5% APY right now) so it earns while it sits.
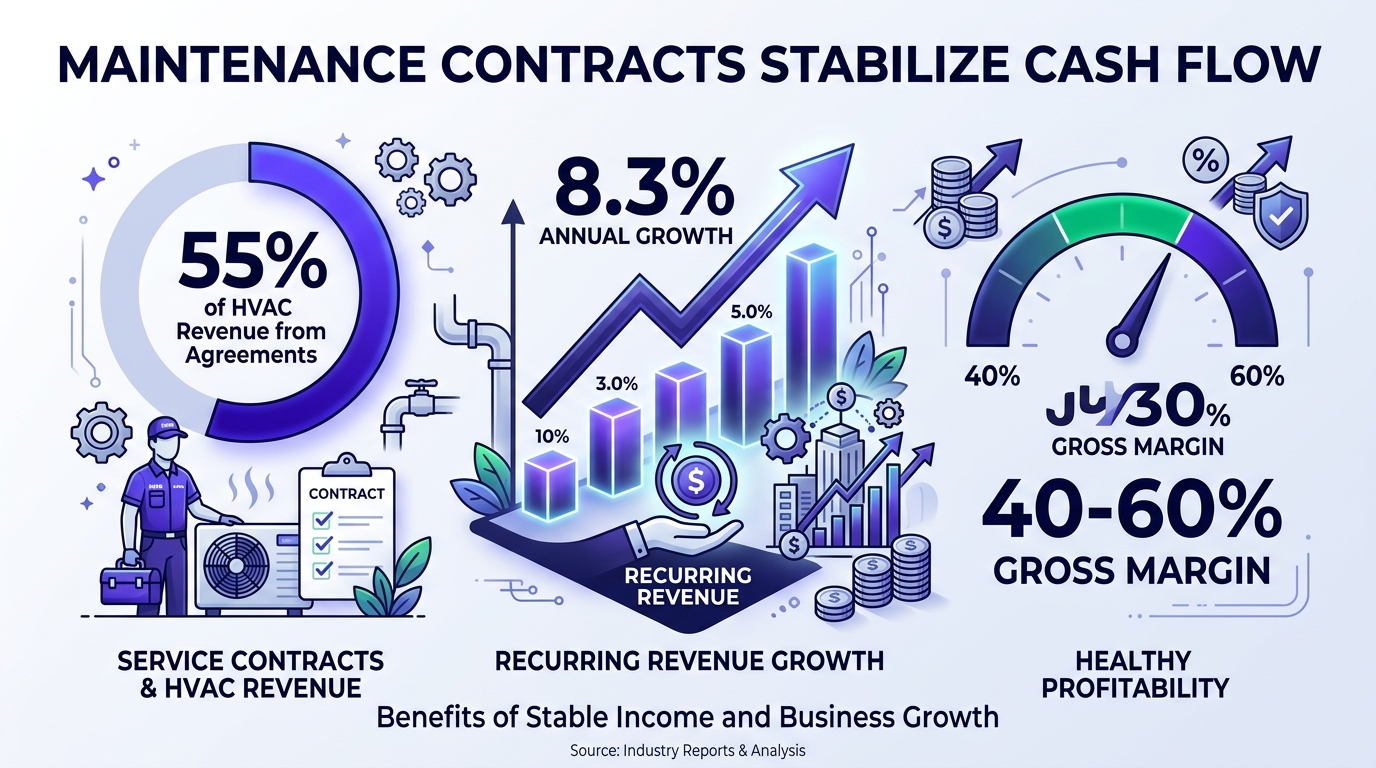
If there is a single lever that does more to stabilize HVAC seasonal cash flow than anything else, it’s maintenance agreements. The data backs this up: maintenance contracts account for approximately 55% of total HVAC service revenue in well-run companies, and the segment is growing at 8.3% annually according to ACCA (Air Conditioning Contractors of America) industry benchmarks.
A maintenance agreement is recurring revenue that arrives in dead zones. When a customer pays $199/year for two tune-ups (spring AC, fall heating), that revenue is recognized in March-May and September-November — the exact months where your service call volume craters.
The margin profile is equally compelling:
For a $2M HVAC company, shifting from 200 maintenance agreements to 600 agreements adds roughly $80,000 in annual recurring revenue — with most of it landing in shoulder season months. That alone can shrink the October revenue gap by 40%.
Refrigerant, condensing units, and furnaces all have seasonal pricing patterns that mirror demand. Contractors who buy reactively during peak season pay a premium. Contractors who plan ahead lock in lower costs and protect margins.
Refrigerant (R-410A and R-454B): Prices typically spike 15-25% between April and July as distributors face summer demand. Buy your summer inventory in February or March when prices are at their annual low. A $2M HVAC company that uses $30,000 in refrigerant annually can save $5,000-$7,000 by pre-purchasing.
Equipment pre-buys: Major manufacturers (Carrier, Trane, Lennox) offer early-buy programs in Q4 with 3-5% discounts on equipment orders placed before January. On a $400,000 annual equipment spend, that’s $12,000-$20,000 in margin protection.
Parts inventory: Stock high-failure components (capacitors, contactors, blower motors) before peak seasons. Running out of a $12 capacitor on a Saturday in July means a $200 emergency parts run — or worse, a lost customer.
Pro Tip: Create a purchasing calendar tied to your seasonal forecast. Map every major inventory purchase to a specific month and negotiate terms with your distributors in advance. The 5 hours you spend planning in January saves $15,000-$25,000 across the year.
Both tools serve a purpose, but they’re not interchangeable. Smart HVAC contractors use them in combination.
Use your cash reserve for predictable seasonal dips — the October and April slowdowns you can see coming 6 months away. These are expected shortfalls, not emergencies, and financing them with debt is unnecessary.
Best for: Covering payroll during shoulder seasons, funding pre-season inventory purchases, absorbing the natural revenue dip between heating and cooling demand.
A $100,000-$200,000 revolving credit line at prime + 1-2% gives you emergency capacity beyond your reserve. Use it for genuine surprises — not for predictable seasonal dips.
Best for: Emergency vehicle replacement, unexpected warranty liability, a commercial project that requires front-loaded material purchases, bridging a gap when a large invoice pays net-60.
The critical rule: If you’re drawing on your line of credit during the same months every year, that’s not an emergency — it’s a planning failure. Move those costs into your cash reserve strategy and save the credit line for actual unknowns.
| Scenario | Use Cash Reserve | Use Line of Credit |
|---|---|---|
| October payroll shortfall | Yes | No |
| Truck transmission failure in September | No | Yes |
| Pre-season refrigerant purchase | Yes | No |
| $80K commercial job requires upfront materials | No | Yes |
| Q1 workers’ comp audit adjustment | Depends on size | If > $20K |
| Slow April after unusually warm winter | Yes | No |
Historical data is the best forecasting tool you have. If you’ve been in business for 3+ years, your monthly revenue percentages (shown in the table above) are remarkably stable year over year, usually within 5-10% of the trailing average.
Step 1: Pull your monthly revenue for the last 3 years from QuickBooks or your accounting system. Calculate each month as a percentage of annual revenue.
Step 2: Average the 3-year percentages for each month. This is your seasonal index. January might average 8.8%, July might average 12.5%.
Step 3: Multiply your projected annual revenue by each month’s seasonal index. If you’re forecasting $2.2M next year, January = $2.2M x 8.8% = $193,600.
Step 4: Layer in your fixed costs month by month. The difference between forecasted revenue and forecasted costs is your net cash position — and any month where that number goes negative needs a funded plan (reserve draw, credit line, or deferred spending).
Step 5: Update quarterly. Actual Q1 results should refine your full-year projection. If heating season underperformed by 10%, adjust your summer forecast upward only if you have evidence (new marketing, expanded service area) — otherwise, plan for a softer year.
The dead zones don’t have to be dead. Contractors who diversify into complementary services can recapture 20-30% of the revenue gap during shoulder months.
Duct cleaning, air purifier installation, UV germicidal lights, and whole-home humidifier/dehumidifier installs. IAQ demand is less seasonal than heating and cooling — allergy season (spring) and dry winter air both drive inquiries. Average ticket: $400-$1,200. Margins: 50-65%.
Partner with local utility rebate programs to offer blower door tests, insulation assessments, and duct sealing. Many utilities pay referral fees or co-fund the audit. Average ticket: $200-$500 for the audit, with $2,000-$8,000 in follow-on work (insulation, duct sealing, equipment upgrades).
Commercial buildings run HVAC year-round. A single 10-unit strip mall contract at $150/unit/quarter generates $6,000/year in predictable revenue — and commercial PM visits are scheduled in shoulder months by design.
If your techs are already in basements and mechanical rooms, water heater replacement and tankless installs are a natural extension. Average ticket: $1,800-$4,500. Training investment is minimal for licensed HVAC techs.
Important: Diversification works only if you track profitability by service line. Adding revenue that carries negative margin makes cash flow worse, not better. Use job costing to validate that each new service pulls its weight.
Managing HVAC seasonal cash flow isn’t a once-a-year exercise. It’s a monthly discipline with quarterly checkpoints.
January-February: Peak heating. Skim 12-15% into reserves. Place early-buy equipment orders. Renew credit line terms with your bank.
March-April: Dead zone hits. Deploy marketing for AC tune-ups and maintenance agreement renewals. Schedule IAQ and duct cleaning campaigns. Draw from reserves if needed — that’s what they’re for.
May: Pre-summer prep. Buy refrigerant inventory. Hire seasonal techs. Confirm maintenance agreement schedule is loaded in your field service software.
June-August: Peak cooling. Skim 12-15% into reserves. Push maintenance agreement signups on every service call. This is where you fund the next dead zone.
September-October: Fall dead zone. Shift crews to commercial PM, IAQ installs, and energy audits. Launch furnace tune-up marketing. Use reserves, not credit line, for expected shortfalls.
November-December: Heating ramp. Revenue stabilizes. Finalize next year’s 12-month forecast using this year’s actuals. Negotiate vendor terms for Q1 early-buy programs.
The contractors who follow this cadence don’t panic in October. They planned for October in July.
Stop guessing and start planning your cash flow. Steph’s Books provides outsourced bookkeeping built specifically for HVAC contractors — including seasonal cash flow forecasting, job costing by service type, and monthly financial reporting that shows you exactly where your money is going. Get an instant quote or schedule a free consultation to see how we can help stabilize your year-round finances.
Answer a few quick questions for an instant, no-obligation quote — no sales call required. See how Steph's Books saves you 40-60% vs. hiring in-house.