Most law firms track revenue. The profitable ones track what drives it. The difference between a firm earning 40% margins and one scraping by at 15% usually comes down to seven numbers that managing partners either review monthly — or ignore until year-end when it’s too late to fix.
These aren’t vanity metrics. These are the law firm financial KPIs that tell you whether attorneys are billing efficiently, clients are paying on time, overhead is under control, and partners are earning what they should. If you’re running a $1M–$10M firm and not reviewing these monthly, you’re flying blind.
Here’s the full framework — formulas, benchmarks, red flags, and what to do when a number looks wrong.
Before diving into each metric, here’s the summary table you can pin to your monthly review agenda.
| KPI | Formula | Healthy Benchmark | Warning Threshold |
|---|---|---|---|
| Realization Rate | Billed Hours ÷ Worked Hours × 100 | 85–95% | Below 80% |
| Collection Rate | Cash Collected ÷ Total Billed × 100 | 90–98% | Below 85% |
| Revenue Per Lawyer | Total Revenue ÷ Number of Lawyers | $250K–$600K+ (varies by market) | Below $200K |
| Cost Per Matter | Total Matter Costs ÷ Number of Matters | Varies by practice area | Rising quarter-over-quarter with no revenue increase |
| Overhead Ratio | Operating Expenses ÷ Gross Revenue × 100 | Under 45% | Above 50% |
| AR Aging | Average Days from Invoice to Payment | Under 60 days | Above 90 days |
| Profit Per Equity Partner | Net Income ÷ Number of Equity Partners | $200K–$1M+ (varies by market/size) | Declining year-over-year |
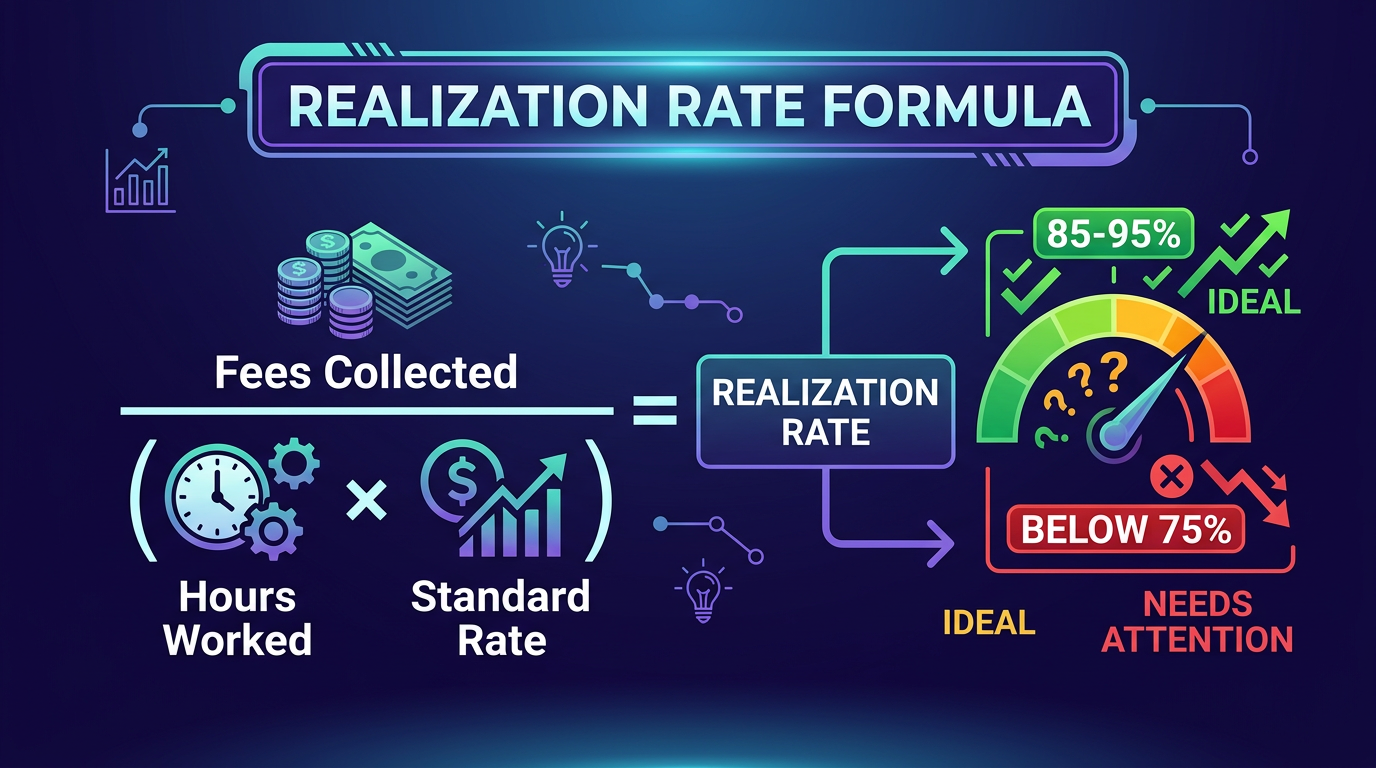
Formula: Billed Hours ÷ Worked Hours × 100
Benchmark: 85–95%
Realization rate measures how much of the work your attorneys perform actually makes it onto an invoice. An attorney who logs 8 hours but only bills 6.5 has a realization rate of 81% — meaning nearly one-fifth of their effort generates zero revenue.
This is the first leak in your revenue pipeline, and it’s often the biggest. According to the Clio 2023 Legal Trends Report, the average lawyer bills only 2.5 hours of an 8-hour day. That’s a realization problem compounded by a utilization problem.
If realization drops below 80%, you’re leaving serious money on the table. A 10-attorney firm billing at $300/hour with 80% realization vs. 90% realization loses roughly $312,000 per year — enough to fund an associate salary.
Pro Tip: Track realization rate by attorney, not just firm-wide. A healthy firm average can mask one or two attorneys running at 65–70%, which pulls down the entire P&L. Your law firm bookkeeping system should surface this by timekeeper.
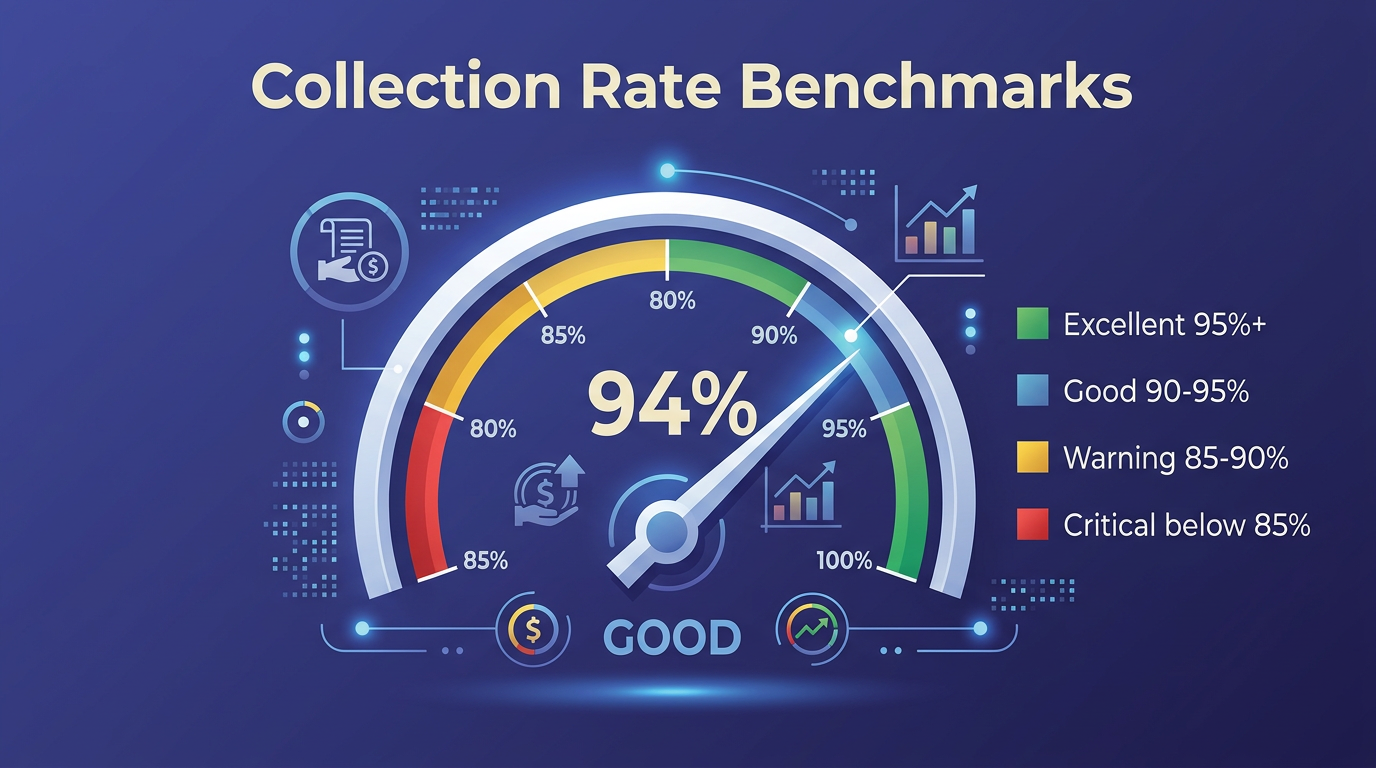
Formula: Cash Collected ÷ Total Billed × 100
Benchmark: 90–98%
Collection rate tells you what percentage of billed work actually converts to cash in the bank. You can bill $2M and still have a cash crisis if you’re only collecting 82% of it.
This metric sits downstream from realization — it’s the second filter. Hours worked become hours billed (realization), and hours billed become cash collected (collection). Every percentage point lost at either stage compounds.
A collection rate below 85% means you’re writing off more than $1 of every $7 billed. At that point, you don’t have a billing rate problem — you have a client quality or collections process problem.
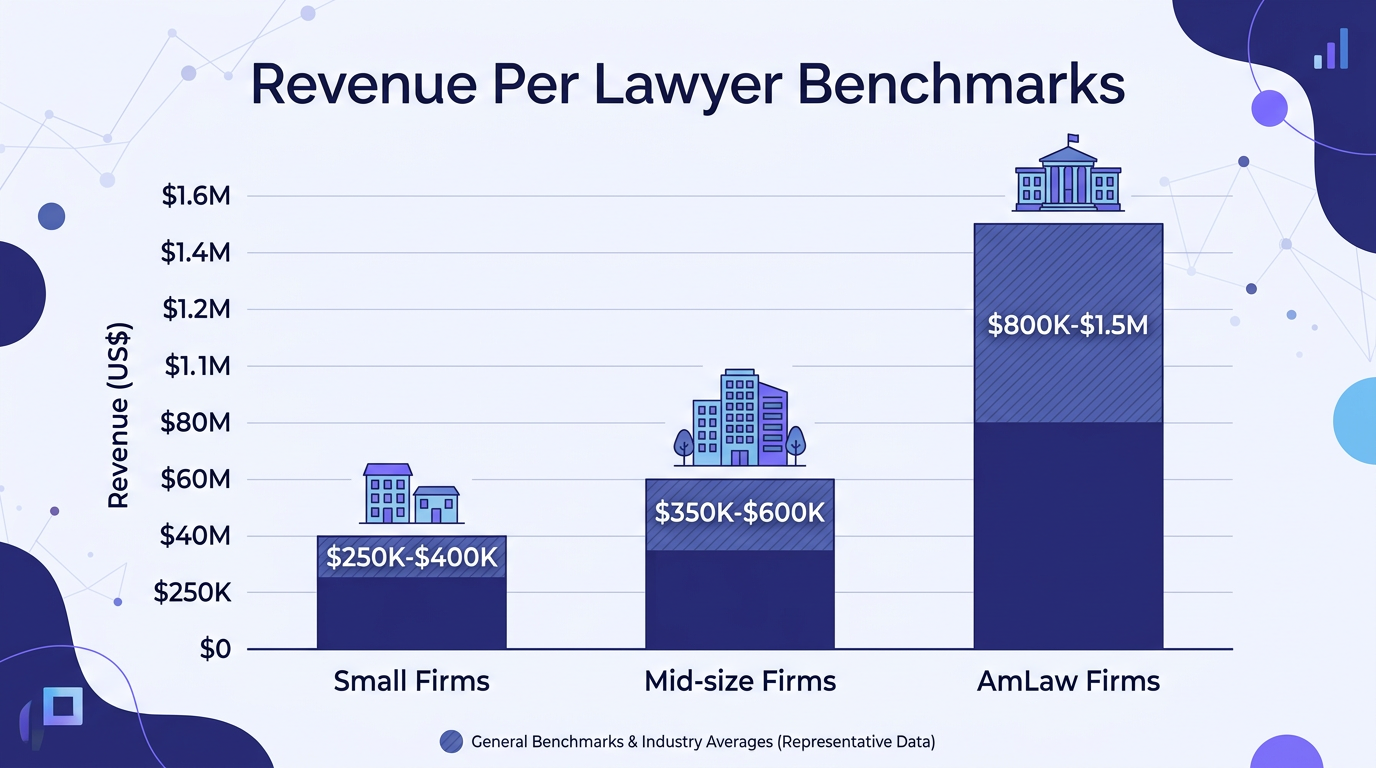
Formula: Total Revenue ÷ Number of Lawyers (including equity and non-equity partners, associates, and of-counsel)
Benchmark: $250K–$600K+ depending on practice area, market, and firm size
Revenue per lawyer (RPL) is the single best proxy for firm productivity. It normalizes across firm sizes and tells you whether adding that last associate increased the pie or just divided it into smaller slices.
The Thomson Reuters 2024 Report on the State of the Legal Market found that Am Law 200 firms averaged over $1M RPL, while midsize firms typically range $300K–$600K. For a firm in the $1M–$10M range, anything below $200K per lawyer signals underutilization.
RPL declining quarter-over-quarter while headcount stays flat means your team is generating less work — either a demand problem (pipeline drying up) or an efficiency problem (more non-billable time).
Benchmark in Context: RPL varies dramatically. A solo estate planning attorney in a secondary market at $280K RPL may be outperforming a Big Law associate generating $500K RPL when you account for overhead and leverage ratios. Always compare against your own historical trend first, market benchmarks second.
Formula: Total Direct + Indirect Matter Costs ÷ Number of Matters Closed
Benchmark: Varies by practice area — the critical metric is the trend, not the absolute number
Cost per matter reveals whether your firm is getting more or less efficient at delivering legal work. It forces you to look at the expense side of each engagement.
Direct costs include attorney time (at cost, not billing rate), paralegal hours, filing fees, and expert witness fees. Indirect costs include allocated overhead — rent, technology, insurance, and support staff attributable to each matter.
Cost per matter rising quarter-over-quarter with no corresponding increase in matter complexity or revenue is a structural efficiency problem. If you’re spending more to deliver the same work, margins are compressing.
Track this by practice area and matter type — a blended firm-wide average hides too much. Your litigation cost per matter and your transactional cost per matter will look completely different, and that’s expected.
Formula: Total Operating Expenses (excluding attorney compensation) ÷ Gross Revenue × 100
Benchmark: Under 45%
Warning threshold: Above 50%
Overhead ratio measures how many cents of every revenue dollar go to keeping the lights on. It includes rent, support staff, technology, insurance, marketing, and every other non-attorney expense.
A firm generating $3M with $1.5M in overhead runs at 50% — half of every dollar goes to operations before a single partner draws a check.
Overhead above 50% puts your firm in dangerous territory. It means every dollar of attorney compensation and partner draws has to come from the remaining half of revenue, leaving almost no margin for reinvestment, bonuses, or downturns.
Action Item: Pull your last 12 months of expenses and categorize every line item as “attorney compensation” or “overhead.” If you can’t do this cleanly in your current accounting setup, your chart of accounts needs restructuring — a law firm bookkeeping specialist can set this up in a day.
Formula: Average number of days from invoice date to payment receipt
Benchmark: Under 60 days
Warning threshold: Above 90 days
AR aging is the metric that connects your income statement to your cash flow statement. You can show $500K in revenue for the quarter and still not make payroll if $300K of it sits in receivables past 90 days.
The goal: shorten the gap between sending an invoice and depositing the payment. Every day an invoice sits unpaid, your firm is financing the client’s legal work at zero interest.
If more than 20% of your total AR sits in the 90+ day bucket, you have a systemic collections problem that’s threatening cash flow. A healthy firm keeps 90+ day AR under 10% of total receivables.
Formula: Net Income (after all expenses, taxes, and non-equity compensation) ÷ Number of Equity Partners
Benchmark: $200K–$1M+ depending on firm size, market, and practice mix
Warning threshold: Declining year-over-year
PPEP is the ultimate bottom-line metric. It answers the question every equity partner actually cares about: “What am I taking home?”
But PPEP isn’t just a compensation metric — it’s a diagnostic tool. When PPEP declines, it forces you to trace backward through every other KPI on this list to find the cause. Every metric in this article feeds PPEP: hours worked get filtered by realization, then by collection, then reduced by overhead, then divided among partners. If any stage leaks, PPEP drops. That’s why reviewing all seven KPIs together gives you the complete picture.
PPEP declining year-over-year while revenue is flat or growing signals margin compression. The usual culprits: overhead growth outpacing revenue, realization erosion, or equity dilution (adding partners without proportional revenue growth).
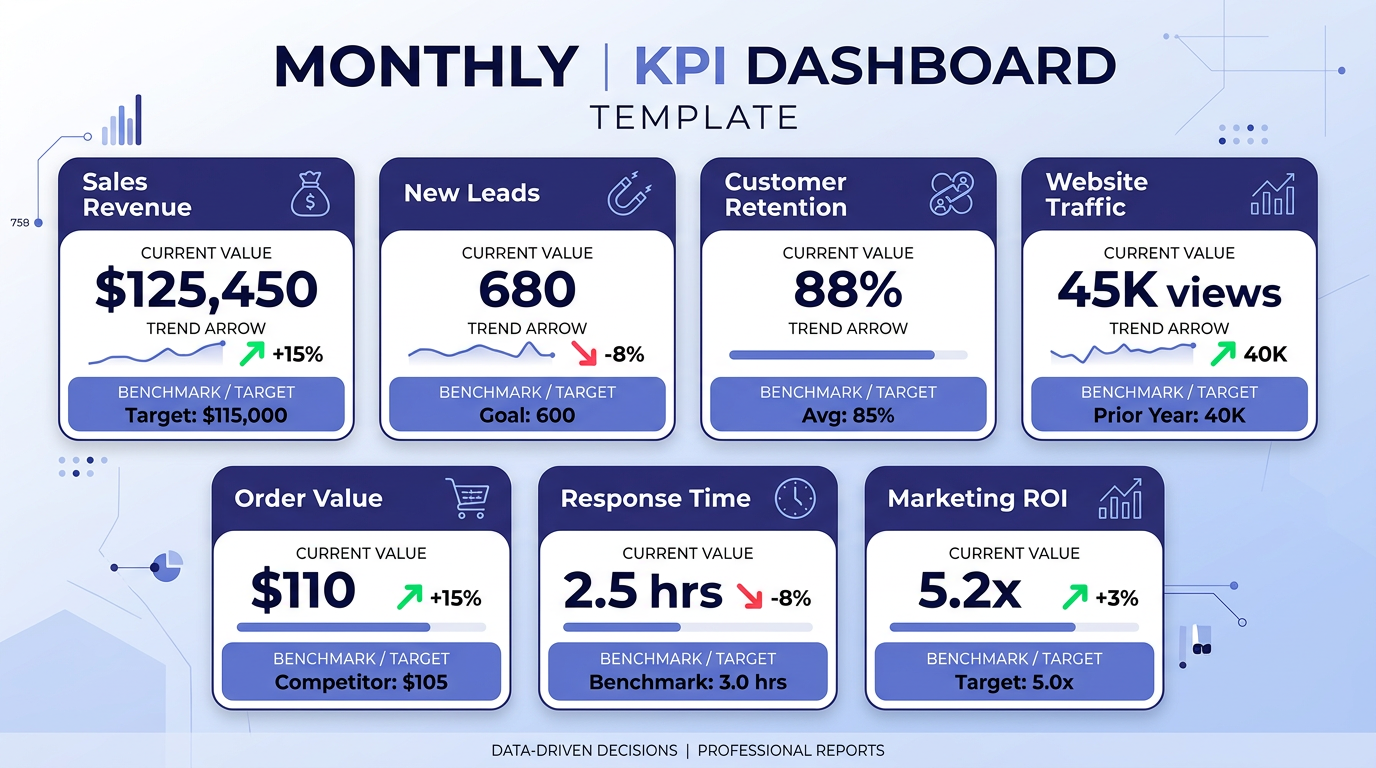
Knowing these seven metrics is useless if you don’t build a system to review them. Here’s the cadence that works for firms in the $1M–$10M range:
Weekly: Quick check on AR aging and cash position. Prevents surprises.
Monthly: Full review of all seven KPIs in a 30-minute managing partner meeting. Compare to the prior month and the same month last year. Flag anything outside benchmark range.
Quarterly: Deep dive into trends. Three consecutive months of decline in any KPI is a structural issue, not a blip.
Your accounting platform should generate these reports automatically. If you’re on QuickBooks Online with Clio, the data exists — but it often requires manual extraction. A dedicated law firm bookkeeping team can build a KPI dashboard that pulls these numbers automatically so you’re reviewing insights, not building spreadsheets.
The real power of tracking law firm financial KPIs is the compounding effect when you improve several by small amounts simultaneously.
Consider a 10-attorney firm billing $350/hour: improving realization from 85% to 90% adds ~$280K/year. Improving collection from 90% to 95% adds another ~$250K. Reducing overhead from 48% to 43% frees up ~$265K. Combined, those three modest improvements add nearly $800,000 to the bottom line — without raising rates or adding clients.
Related Reading:
Ready to get your firm’s financial KPIs under control? Steph’s Books provides dedicated bookkeeping for law firms — including monthly KPI dashboards, trust account reconciliation, and clean financials your accountant will actually thank you for. Schedule a free consultation →
Answer a few quick questions for an instant, no-obligation quote — no sales call required. See how Steph's Books saves you 40-60% vs. hiring in-house.