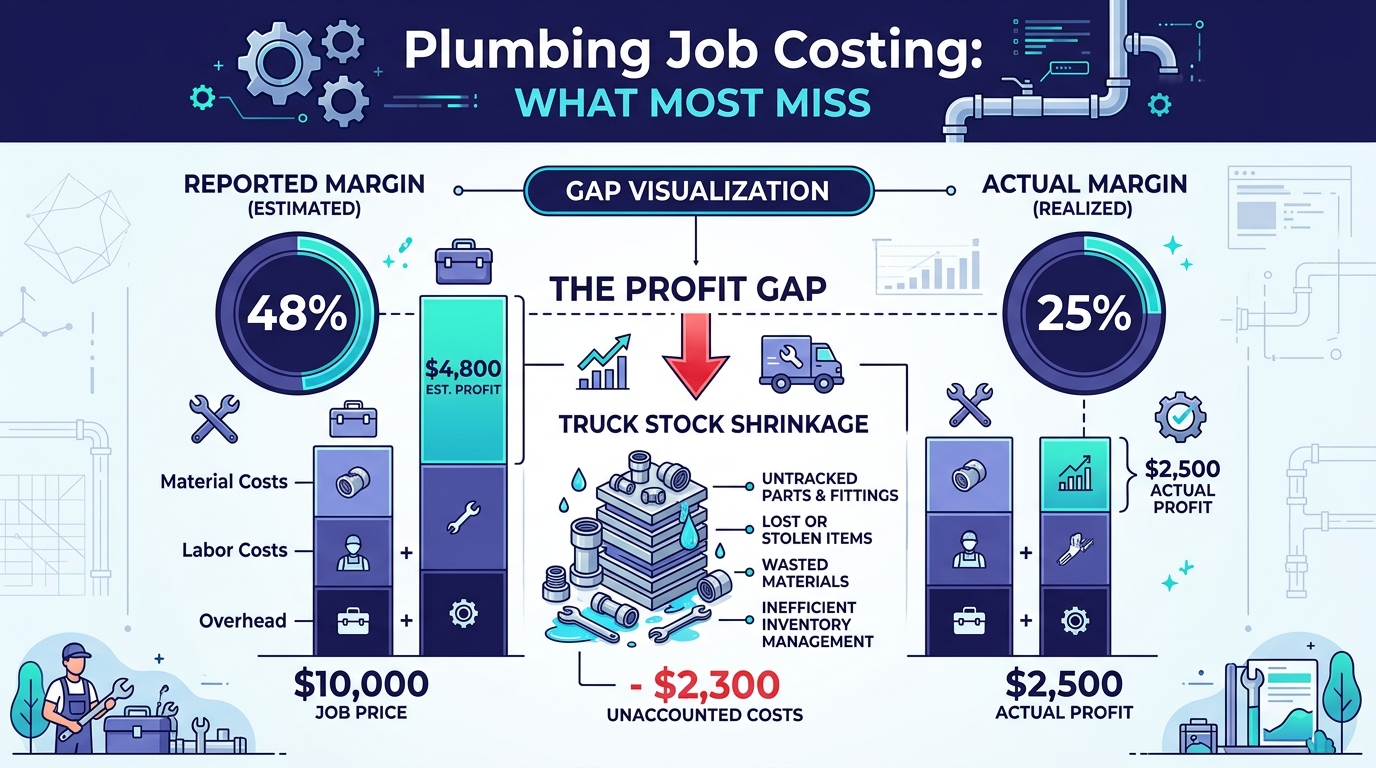
A plumbing company owner ran 800 jobs last year. Ask him which ones made money, and he’ll point to his gross margin report: 55%. But his bank account tells a different story. Truck stock shrinkage on those 800 service calls? Unmeasured. Unbilled change orders on three commercial remodels? Written off. Labor burden rates calculated with a single blended number instead of the actual cost difference between an apprentice and a master plumber? Baked in wrong from day one. Bookkeeping for plumbers isn’t about recording deposits and paying bills — it’s about building a financial system that tells you which trucks, techs, and service lines are actually generating profit.
This guide covers every bookkeeping challenge specific to plumbing contractors between $1M and $10M in revenue. If you already know what a P&L is and you’re past the startup phase, this is where you go deeper — into the job costing systems, inventory controls, and financial benchmarks that separate a plumbing company that’s busy from one that’s profitable.
Plumbing companies operate in a financial environment that most general bookkeepers have never seen. The revenue mix alone creates complexity that doesn’t exist in retail, consulting, or even other trades.
A single plumbing company might run four completely different businesses under one roof:
Blending those four revenue streams into a single margin number is meaningless. A company doing $3M with 70% service work and 30% drain cleaning operates in a fundamentally different financial reality than one doing $3M split 50/50 between service and new construction — even if both report the same top-line revenue.
Plumbing is one of the few trades where significant inventory lives on trucks, not in a warehouse. Every service van carries $3,000-$8,000 in parts and fittings. When a tech uses a $45 ball valve on a repair and doesn’t log it, that cost never hits the job. Multiply that across 15 trucks and 200 service calls per month, and you’re looking at $2,000-$5,000/month in invisible COGS.
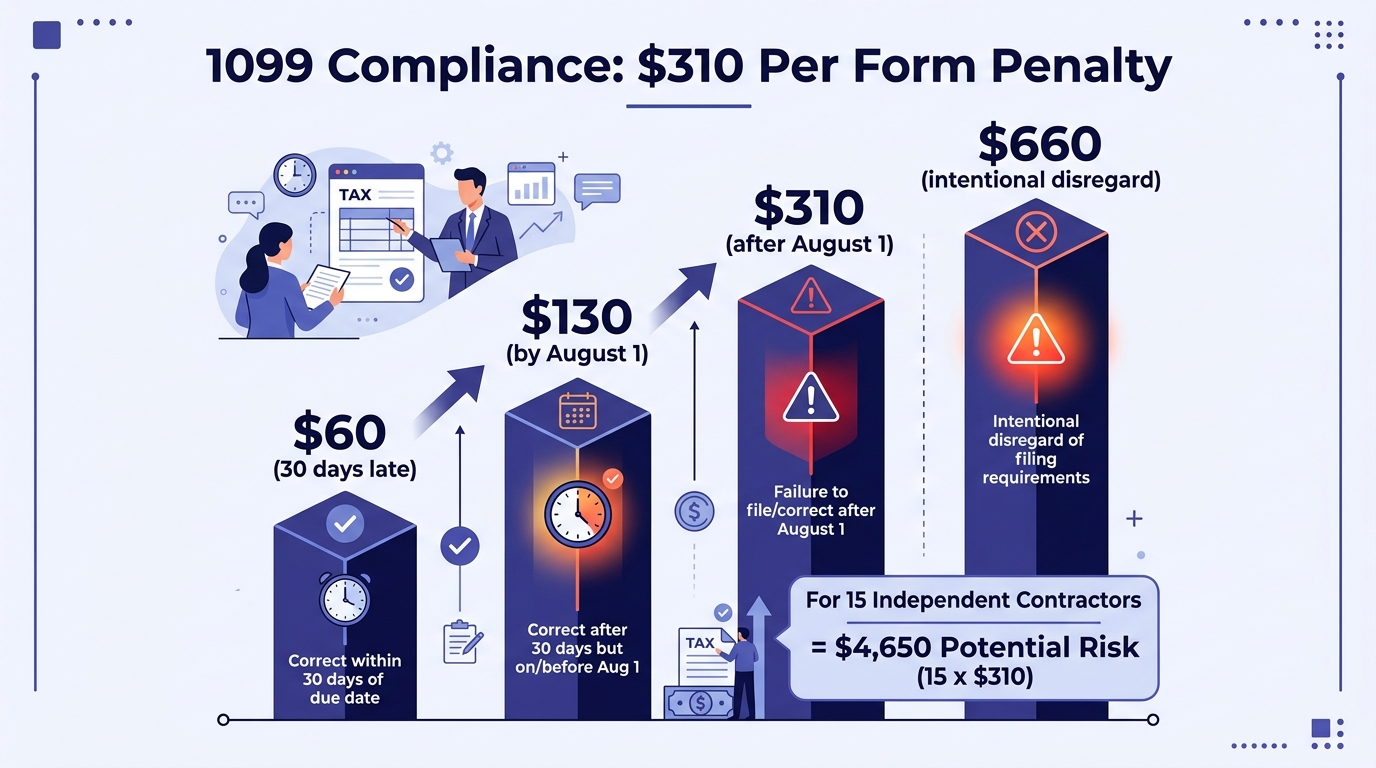
Even mid-size plumbing companies rely on subcontractors for specialized work — gas line certifications, trenchless sewer lining, backflow testing, camera inspections. Each sub needs W-9 documentation, payment tracking, and year-end 1099 reporting. Miss one, and the IRS penalty is $310 per form.
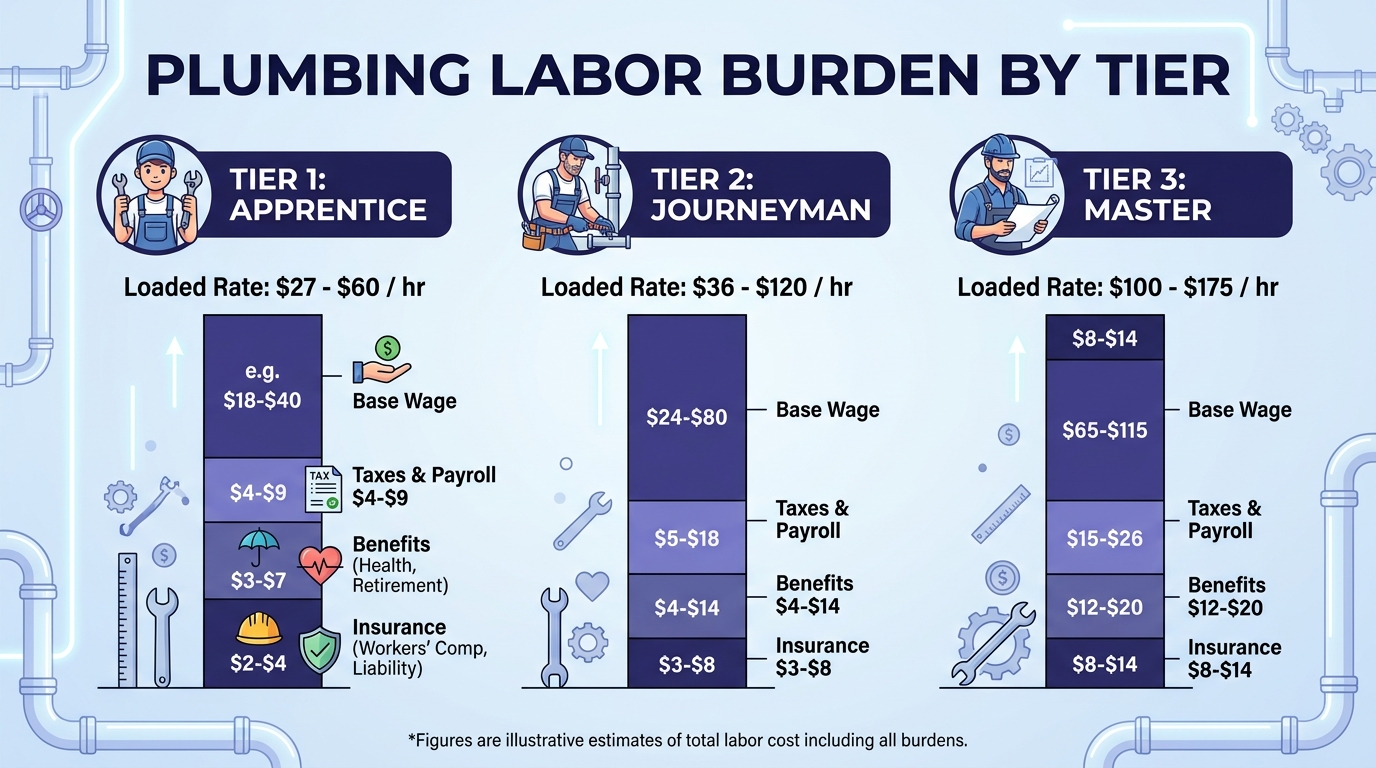
An apprentice plumber costs $27-$60/hour fully loaded. A master plumber costs $100-$175/hour. Using a single blended burden rate means you’re overcosting every apprentice job and undercosting every master plumber job — which makes your profitability data unreliable at the job level.
Bottom line: A general bookkeeper who treats your plumbing company like a standard service business will produce financial statements that look correct but hide the profit leaks that matter most. Specialized bookkeeping for plumbers requires industry-specific chart of accounts, job costing, and inventory tracking.
Your chart of accounts is the foundation of every financial report you’ll ever pull. Get it wrong, and your P&L tells you nothing useful. Get it right, and you can answer questions like “what’s my gross margin on drain cleaning vs. new construction?” in under 60 seconds.
Here’s a plumbing-specific chart of accounts structure:
| Account # | Account Name | Type |
|---|---|---|
| 4000 | Service & Repair Revenue | Income |
| 4010 | Drain Cleaning Revenue | Income |
| 4020 | Remodel/Renovation Revenue | Income |
| 4030 | New Construction Revenue | Income |
| 4040 | Maintenance Agreement Revenue | Income |
| 4050 | Warranty Work Revenue | Income |
| Account # | Account Name | Type |
|---|---|---|
| 5000 | Field Labor — Apprentice | COGS |
| 5010 | Field Labor — Journeyman | COGS |
| 5020 | Field Labor — Master Plumber | COGS |
| 5030 | Labor Burden (FICA, WC, Benefits) | COGS |
| 5040 | Materials & Parts | COGS |
| 5050 | Truck Stock | COGS |
| 5060 | Equipment Rental | COGS |
| 5070 | Subcontractor Costs | COGS |
| 5080 | Permits & Inspections | COGS |
| Account # | Account Name | Type |
|---|---|---|
| 6000 | Vehicle Expenses (Fuel, Maintenance, Lease) | Expense |
| 6010 | Insurance (GL, Vehicle, Umbrella) | Expense |
| 6020 | Workers’ Compensation Insurance | Expense |
| 6030 | Licensing & Continuing Education | Expense |
| 6040 | Tools & Equipment (Non-Capital) | Expense |
| 6050 | Warranty Reserve Expense | Expense |
| 6060 | Office & Administrative | Expense |
| 6070 | Marketing & Advertising | Expense |
| 6080 | Software & Technology | Expense |
In QuickBooks Online, set up Classes for each service type (Service/Repair, Drain Cleaning, Remodel, New Construction) so you can run a P&L by class and see true margins per service line. This is the single most important QuickBooks configuration decision for a plumbing company.
Pro tip: Don’t over-engineer your chart of accounts with 200+ sub-accounts. The goal is granularity where it matters — revenue by type, COGS by labor tier, and subs separated from materials. Everything else can stay consolidated. A chart of accounts you actually use beats a perfect one nobody maintains.
Job costing is where bookkeeping for plumbers either creates actionable intelligence or produces fiction. Every job needs four cost categories tracked individually: labor (by tier), materials/parts, subcontractors, and allocated overhead.
For each job, your bookkeeping system should capture:
A tech runs a $350 service call to replace a kitchen faucet. Your dispatch software shows 1.5 hours of labor. Here’s what actually happened:
| Cost Component | Reported | Actual |
|---|---|---|
| Labor (Journeyman, 1.5 hrs @ $75/hr loaded) | $112.50 | $112.50 |
| Faucet + supply lines (invoiced) | $85.00 | $85.00 |
| Truck stock used (fittings, tape, sealant) | $0.00 | $42.00 |
| Overhead allocation (12%) | $23.70 | $28.74 |
| Total Cost | $221.20 | $268.24 |
| Gross Margin | 36.8% | 23.4% |
That’s a 13.4 percentage point gap between what your books show and what actually happened — entirely because $42 in truck stock was never logged. On a single call, it’s $42. Across 800 calls a year with similar patterns, it’s $33,600 in untracked COGS.
Service calls are high-volume, low-touch, and labor-driven. New construction is the opposite: fewer jobs, higher dollar amounts, materials-heavy, and sub-dependent. Your job costing approach needs to handle both.
For service calls, real-time costing through your field service software (ServiceTitan, Housecall Pro, Jobber) is essential. The tech completes the job, the system should capture parts used and time spent, and your bookkeeper reconciles weekly.
For new construction, job costing runs the life of the project — sometimes 6-12 months. Materials are purchased against a budget, subs invoice at milestones, and labor is tracked by phase. Monthly work-in-progress (WIP) reports tell you whether the job is on-budget or bleeding margin before it’s too late.
Here’s something most plumbing company owners don’t think about until they’re ready to sell: your service mix directly determines what your company is worth.
A plumbing company with 70%+ revenue from service and repair work typically sells for 2.5-4x Seller’s Discretionary Earnings (SDE). That premium exists because service revenue is recurring, predictable, and less dependent on any single customer or contract.
A company heavily weighted toward new construction? 1.5-3x SDE. New construction revenue is project-based, bid-dependent, and disappears when the housing market cools. Buyers pay less because the revenue is less predictable.
Use Classes in QuickBooks Online to tag every transaction by service type. Every invoice, every material purchase, every labor entry gets a class assignment. This gives you:
If you’re currently running all revenue through a single income account, you’re flying blind on the metrics that matter most — both for daily operations and eventual exit value.
Valuation reality: A $2M plumbing company doing 75% service/repair at 50% gross margin is worth roughly $1.5M-$2.4M. The same $2M company doing 75% new construction at 15% margin might be worth $450K-$900K. Same revenue, dramatically different value — and your bookkeeping is what proves the split.
Plumbing companies rely on subcontractors more than most trades: trenchless lining specialists, gas line certifiers, backflow testers, excavation crews, camera inspection teams. Each one creates a compliance obligation that your bookkeeping system needs to manage.
Before you pay a subcontractor the first time, you need a completed W-9 on file. No exceptions. This gives you the legal name, tax ID (EIN or SSN), and entity type you’ll need for 1099 reporting at year-end.
Build this into your onboarding process:
The IRS penalty for failing to file a correct 1099 by the deadline is $310 per form (2026). For a plumbing company with 15 active subcontractors, that’s $4,650 in potential fines — for paperwork, not tax evasion.
And that’s the mild scenario. If the IRS determines you’ve misclassified employees as subcontractors — which happens frequently in plumbing when companies use “subs” who work exclusively for them, use company tools, and follow company schedules — the penalties include back payroll taxes, interest, and potential criminal charges.
The IRS looks at three categories to determine if someone is an employee or a subcontractor:
If your “sub” drives your truck, wears your shirt, works your schedule, and only works for you — they’re an employee, regardless of what the contract says. Your bookkeeper should flag any sub who receives more than 1,800 hours of payments in a year for review.
Truck stock is the single most common source of untracked COGS in plumbing companies. Every service van carries fittings, valves, connectors, tape, sealant, solder, and supply lines. When a tech uses $80 in parts on a job and doesn’t log them, your books show higher margins than reality.
It’s rarely theft (though that happens). The real drivers:
Best-in-class plumbing companies reconcile truck stock monthly:
A well-managed plumbing company keeps truck stock shrinkage under 3% of total parts cost. If you’re running above 8%, you have a systemic problem that’s directly eating your gross margin.
The math: If your company purchases $25,000/month in parts and your shrinkage rate is 8%, that’s $2,000/month — $24,000/year — in COGS that never shows up on any job. Your gross margin report is overstated by that amount, and every pricing decision you make based on that margin data is wrong.
Labor is the largest cost component in plumbing, and the spread between your cheapest and most expensive worker is wider than in almost any other trade. Using a single blended burden rate — $65/hour for everyone — makes your job costing useless.
A burden rate includes base pay plus employer-paid payroll taxes (7.65% FICA), workers’ compensation (~$2.65 per $100 of payroll per BLS data), health insurance, retirement contributions, and paid time off.
| Labor Tier | Base Pay Range | FICA (7.65%) | Workers’ Comp (~2.65%) | Benefits | Fully Loaded Rate |
|---|---|---|---|---|---|
| Apprentice (1st-2nd year) | $20-$28/hr | $1.53-$2.14 | $0.53-$0.74 | $3-$5/hr | $25-$36/hr |
| Apprentice (3rd-4th year) | $28-$45/hr | $2.14-$3.44 | $0.74-$1.19 | $4-$7/hr | $35-$57/hr |
| Journeyman Plumber | $27-$55/hr | $2.07-$4.21 | $0.72-$1.46 | $6-$10/hr | $36-$71/hr |
| Journeyman (experienced, 10+ yrs) | $55-$90/hr | $4.21-$6.89 | $1.46-$2.39 | $8-$12/hr | $69-$111/hr |
| Master Plumber | $75-$130/hr | $5.74-$9.95 | $1.99-$3.45 | $10-$15/hr | $93-$158/hr |
| Master Plumber (lead/supervisor) | $100-$130/hr | $7.65-$9.95 | $2.65-$3.45 | $12-$17/hr | $122-$160/hr |
The difference between sending an apprentice ($35/hr loaded) and a master plumber ($140/hr loaded) to a job is $105/hour. On a 4-hour service call, that’s a $420 cost difference. If your books treat them the same, you’re systematically mispricing every job.
In QuickBooks Online, set up each labor tier as a separate payroll item or track through Service Items linked to COGS sub-accounts (5000, 5010, 5020). When time is logged against a job, it should pull the correct tier rate automatically.
If you use field service software that syncs with QuickBooks, make sure the integration maps labor rates correctly by tier — not as a single “labor” line item. This is the most common integration failure we see when providing outsourced bookkeeping for plumbing contractors.
Your pricing model directly impacts how your bookkeeping is structured. And roughly 92% of homeowners prefer flat-rate pricing for residential plumbing work, which means most service-focused companies have moved (or are moving) to flat rate. But the bookkeeping implications are different.
Under flat rate, the customer pays a fixed price regardless of how long the job takes. Your revenue per job is predictable, but your cost per job varies based on tech efficiency, parts used, and job complexity.
Bookkeeping implications:
Under T&M, the customer pays for actual time and marked-up materials. Revenue varies per job, and invoicing requires detailed documentation of hours and parts.
Bookkeeping implications:
Many plumbing companies use flat rate for residential service and T&M for commercial or new construction. This hybrid model requires careful class-based tracking in your accounting system so that financial reports reflect the true economics of each pricing model.
Every plumbing company gets callbacks. A fitting leaks, a water heater fails within warranty, a drain cleaning didn’t fully clear. If you expense these when they happen, your P&L takes unpredictable hits that make month-over-month comparisons useless.
The solution is a warranty reserve — a percentage of job revenue set aside as an Other Current Liability on your balance sheet.
The process:
For a company doing $200,000/month in service revenue at a 1.5% reserve rate, that’s $3,000/month set aside. When a $450 callback hits, it draws from the reserve instead of slamming your operating expenses for that month.
Why this matters: Without a warranty reserve, your February P&L might show 62% gross margin and March shows 54% — not because anything changed operationally, but because three expensive callbacks hit in March. A warranty reserve smooths these fluctuations and gives you a more accurate picture of true monthly profitability.
Most plumbing companies over $1M in revenue run a field service management (FSM) platform alongside QuickBooks Online. The integration between these two systems is where bookkeeping either works smoothly or becomes a reconciliation nightmare.
| Platform | Best For | QuickBooks Sync | Key Limitation |
|---|---|---|---|
| ServiceTitan | $2M+ service companies | Two-way sync | Expensive ($250+/mo per tech), overkill for small shops |
| Housecall Pro | $500K-$3M residential | One-way push to QBO | Limited job costing depth |
| Jobber | $300K-$2M, simple operations | Two-way sync | Weak new construction support |
| FieldEdge | Service + light commercial | Two-way sync | Dated interface, steep learning curve |
Most FSM-to-QuickBooks integrations sync invoices and payments reliably. Where they break down:
Every week, your bookkeeper should:
This reconciliation is the core of what our plumbing bookkeeping services do weekly for contractor clients.
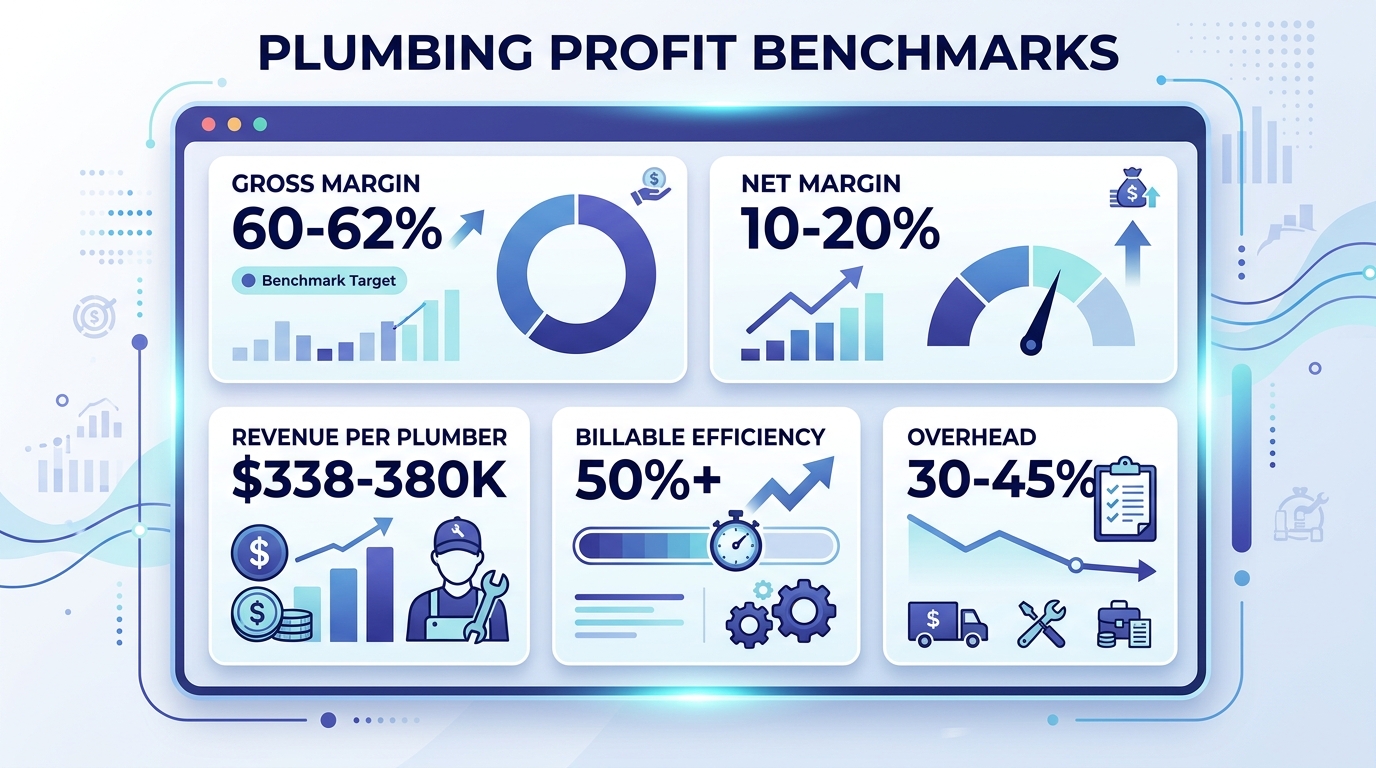
Benchmarking against industry data tells you whether your financial performance is competitive or leaving money on the table. Here are the key metrics for plumbing contractors in the $1M-$10M range:
| Metric | Poor | Average | Well-Run |
|---|---|---|---|
| Gross Margin (Blended) | Below 45% | 50-55% | 60-62% |
| Net Profit Margin | 2-3% | 6-8% | 10-20% |
| Overhead as % of Revenue | 45%+ | 35-40% | 30-35% |
| Revenue per Plumber | Below $250K | $300K | $338K-$380K |
| Billable Efficiency | Below 25% | 30% | 50%+ |
| Truck Stock Shrinkage | 8%+ | 5% | Below 3% |
| Workers’ Comp Rate | Varies | ~$2.65/$100 payroll | ~$2.65/$100 payroll |
| Callback/Warranty Rate | 5%+ | 2-3% | Below 1.5% |
The Bureau of Labor Statistics reports median plumber wages at $62,970/year (May 2024), but fully loaded costs run 30-35% higher when you include burden. Your bookkeeping needs to track the loaded rate, not just the base wage.
Billable efficiency — the percentage of a tech’s paid hours that are actually billed to customers — is the single most important operational metric most plumbing companies don’t track. The industry average is around 30%. That means 70% of the time you’re paying a plumber, they’re driving, waiting, doing paperwork, or sitting between calls. Top performers push this to 50%+ through route optimization, staggered scheduling, and better dispatch.
| Service Line | Target Gross Margin | Key Cost Driver |
|---|---|---|
| Drain Cleaning | 50-70% | Equipment depreciation, labor efficiency |
| Service & Repair | 40-55% | Truck stock, labor tier deployed |
| Remodel/Renovation | 25-40% | Materials, subcontractor costs |
| New Construction | 10-18% | Competitive bidding, long payment cycles |
| Maintenance Agreements | 60-75% | Predictable labor, low materials |
If your blended margin is 50% but you’re doing 40% of your revenue in new construction, the math says your service work margins are strong but your construction margins are compressing the number. Only revenue segmentation (using QuickBooks Classes) reveals this.
There’s a point in every plumbing company’s growth where the owner doing books on Sunday nights stops being scrappy and starts being dangerous. Here are the signs:
| Option | Annual Cost | What You Get |
|---|---|---|
| Owner doing it | “Free” (but 10-15 hrs/week of owner time at $150+/hr value) | Inconsistent, usually behind, no job costing |
| Part-time bookkeeper (in-house) | $45,000-$65,000 + 25-30% burden | One person, limited trade knowledge, vacation coverage issues |
| Outsourced bookkeeping firm (generalist) | $12,000-$30,000/yr ($1,000-$2,500/mo) | Clean books, but may not understand plumbing-specific costing |
| Outsourced bookkeeping firm (trade specialist) | $18,000-$48,000/yr ($1,500-$4,000/mo) | Job costing, truck stock reconciliation, trade benchmarking, 1099 compliance |
The in-house option sounds straightforward until you factor in burden costs (FICA, workers’ comp, benefits, PTO) adding 25-30% on top of salary, plus the reality that a single bookkeeper can’t cover vacations, sick days, or their own blind spots. And finding a bookkeeper who understands plumbing job costing, truck stock reconciliation, and tiered labor burden rates? That’s a unicorn hire.
An outsourced firm specializing in trades gives you a team with built-in redundancy and industry knowledge. Use our instant quote tool to see what it would cost for your specific situation.
The break-even point: Most plumbing companies between $1M and $3M find that outsourcing saves $15,000-$25,000/year compared to a full-time hire — before accounting for the improved financial visibility that prevents the $20K-$50K/year in invisible profit leaks we’ve covered in this guide.
Ready to get your plumbing books right? Steph’s Books specializes in bookkeeping for plumbing contractors. Get an instant quote or schedule a free consultation to see how we can help.
Answer a few quick questions for an instant, no-obligation quote — no sales call required. See how Steph's Books saves you 40-60% vs. hiring in-house.