Most plumbing company owners can tell you their gross revenue to the dollar. Ask them about plumbing profit margins by service line, and you’ll get a long pause. That’s because the number on their P&L — a blended gross margin somewhere around 50% — hides the reality that drain cleaning is subsidizing new construction, truck stock shrinkage is invisible, and three unbilled change orders last month wiped out $12,000 in profit that never showed up anywhere. Understanding your real margins, by service type and by job, is the difference between a plumbing company that grows and one that just stays busy.
For the full picture, see our complete guide to plumbing bookkeeping. This post focuses specifically on the margin benchmarks, the most common profit leaks, and the financial metrics that separate a plumbing business worth 4x earnings from one worth 1.5x.
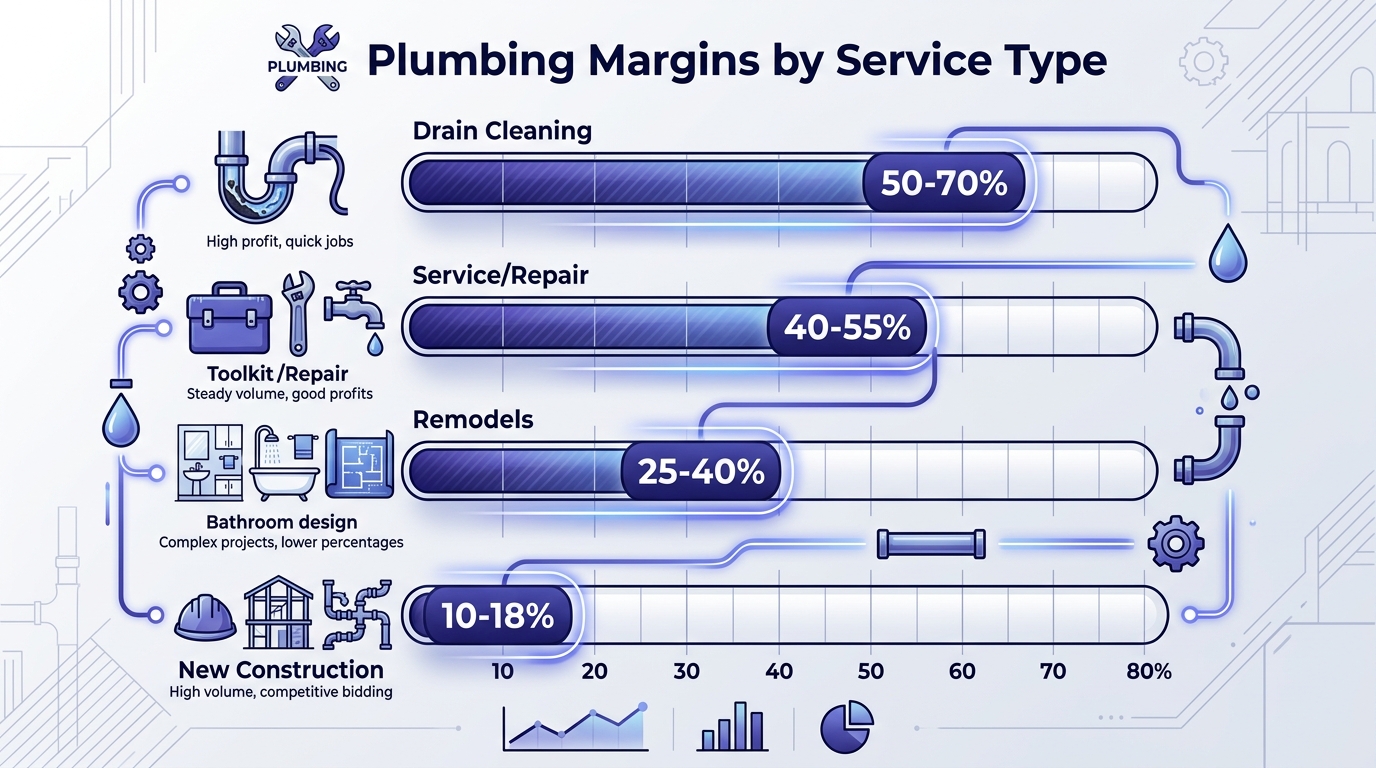
Not all plumbing revenue is created equal. A dollar of drain cleaning revenue and a dollar of new construction revenue carry completely different cost structures. Here’s how gross margins break down by service line for plumbing contractors in the $1M-$10M range:
| Service Line | Gross Margin Range | Primary Cost Driver |
|---|---|---|
| Drain Cleaning | 50-70% | Equipment depreciation, labor efficiency |
| Service & Repair | 40-55% | Truck stock parts, labor tier deployed |
| Remodels / Renovation | 25-40% | Materials, subcontractor costs, change orders |
| New Construction | 10-18% | Competitive bidding, long payment cycles, retainage |
Drain cleaning commands the highest margins because it’s labor- and equipment-intensive with minimal materials cost. A two-person crew with a jetter and a camera can run six to eight calls per day at $250-$500 per call. The equipment depreciates over years, so the per-call cost is low once you’ve made the capital investment.
Service and repair is the bread and butter — the highest-volume line for most plumbing companies. Margins here depend heavily on which tech you dispatch (apprentice vs. master plumber), how efficiently truck stock is tracked, and whether your flat-rate pricing reflects actual costs. Companies that track margins at the job level consistently outperform those using a blended number.
Remodel and renovation work lives in the 25-40% range because materials represent a much larger percentage of the job cost, subcontractors get involved for specialty work (tile, countertops, gas line relocation), and the project timeline introduces risk. Every day a remodel runs long, your labor cost grows while revenue stays fixed.
New construction has the thinnest margins in plumbing. Competitive bidding drives prices down, payment cycles stretch 60-90 days with retainage, and scope changes are constant. Plumbing contractors doing heavy new construction often run blended margins 10-15 points lower than service-dominant companies — even at the same revenue level.
Gross margin tells you how efficiently you deliver work. Net profit margin tells you how much you actually keep. And for most plumbing contractors, the number is uglier than they think.
Here’s the reality:
| Performance Level | Net Profit Margin | At $2M Revenue |
|---|---|---|
| Poorly managed | 2-3% | $40,000-$60,000 |
| Industry average | 5-8% | $100,000-$160,000 |
| Well-run | 10-20% | $200,000-$400,000 |
Most plumbing companies fall in the 5-8% net margin range. That means a $2M company is netting $100K-$160K — enough to survive, but not enough to build real equity, fund growth, or weather a bad quarter.
Now compare that to a well-run company at 15-20% net margin. At the same $2M revenue, that’s $300K-$400K to the bottom line. The difference between 10% and 20% net margin at $2M is $200,000 per year. Over five years, that’s a million dollars. Same trucks, same techs, same service area — different financial systems.
The gap between 5% and 15% isn’t about working harder. It’s about knowing where the money goes — which jobs are profitable, which techs are efficient, which service lines are subsidizing others, and which overhead costs have crept up without anyone noticing.
The math that matters: At 10% net margin on $2M, you take home $200K and your company is worth roughly $500K-$800K. At 20% net margin on the same revenue, you take home $400K and the company is worth $1M-$1.6M. Same top line, double the wealth.
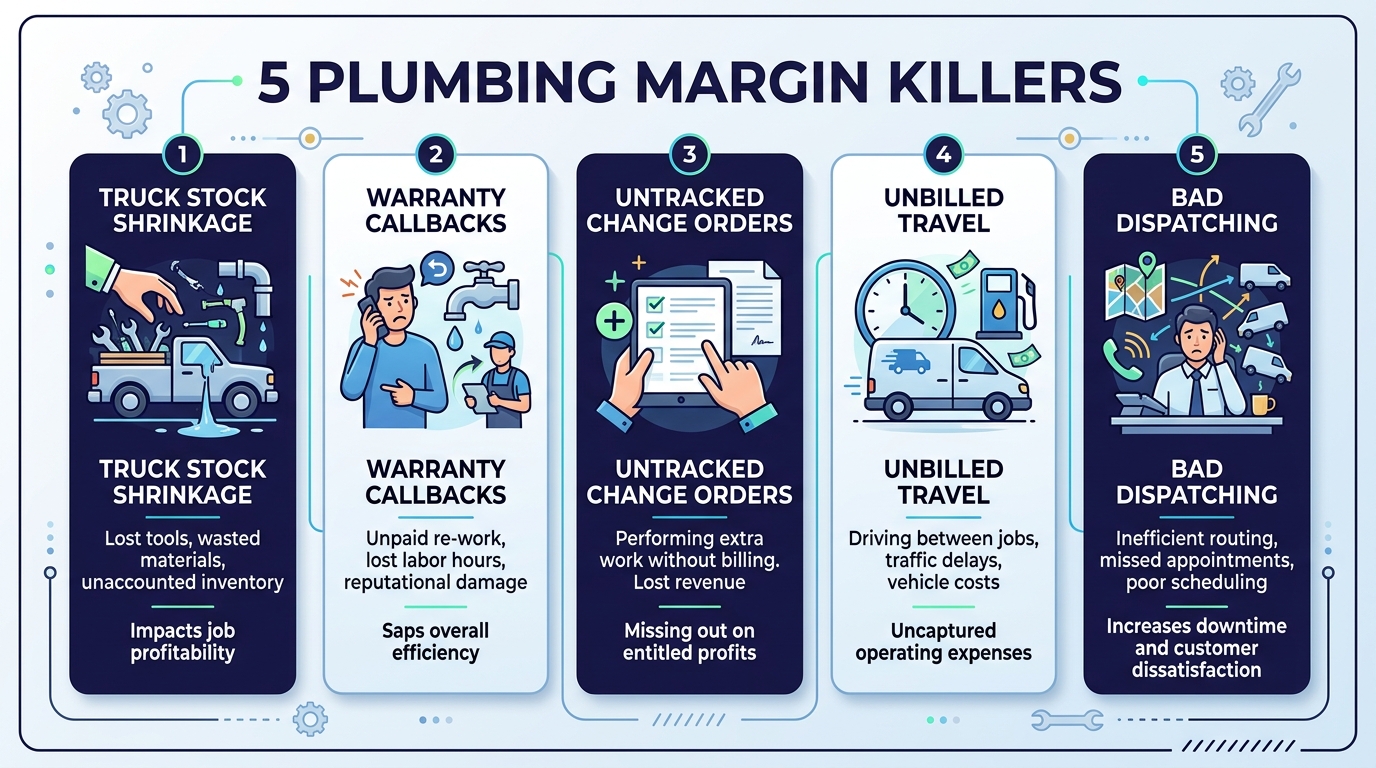
We see the same five profit leaks in almost every plumbing company we work with. Each one is invisible unless your bookkeeping is set up to catch it.
Every service van carries $3,000-$8,000 in parts and fittings. When a tech uses a $45 ball valve or a $12 PVC coupling and doesn’t log it to the job, that cost vanishes into overhead instead of hitting job-level COGS. Across a fleet of 10-15 trucks and 200+ monthly service calls, untracked truck stock easily runs $2,000-$5,000 per month — that’s $24,000-$60,000 per year in invisible cost that inflates your reported gross margin and deflates your actual net profit.
Well-managed companies keep shrinkage below 3% of total parts cost. The industry average is closer to 5-8%. Monthly physical counts and reconciliation against purchase orders are the only fix.
A fitting leaks three weeks after install. A water heater fails under warranty. A drain cleaning didn’t fully clear. Every callback costs labor and parts with zero revenue. If these hit your P&L as they happen, your monthly margins swing wildly — 58% one month, 48% the next — making it impossible to identify real trends.
The fix is a warranty reserve: set aside 1-2% of service revenue as a liability, then draw from it when callbacks occur. Without a reserve, you’re reacting to surprises instead of planning for predictable costs.
On remodel and commercial jobs, scope changes happen constantly. A homeowner wants to move a drain line. A GC adds a bathroom. If the change order isn’t documented and billed separately, you absorb the extra labor and materials cost on a fixed-price contract. We’ve seen single untracked change orders cost plumbing companies $3,000-$8,000 on mid-size remodels. Three of those per quarter will destroy a quarter’s profit margin.
The Bureau of Labor Statistics reports median plumber pay at $62,970/year, but a master plumber’s fully loaded cost runs $100-$160/hour when you include burden (FICA, workers’ comp, benefits). If that $130/hour loaded master plumber drives 45 minutes to a $200 drain call, you’ve spent $97.50 in labor just getting there — before the work even starts. For residential service companies, unbilled travel can eat 15-25% of total labor cost.
This one compounds everything above. Sending a master plumber on a job an apprentice can handle costs you $60-$80/hour in unnecessary labor burden. Running trucks across town instead of clustering calls by geography adds drive time to every job. Poor dispatching is the single biggest reason the industry average billable hour efficiency sits at just 30% — meaning 70% of paid tech time generates zero revenue.
After gross margin, overhead as a percentage of revenue is the next number that determines whether you’re profitable or just spinning. Overhead includes everything that isn’t direct job cost: office rent, admin salaries, insurance, marketing, vehicle payments, software subscriptions, and owner compensation.
| Overhead Level | % of Revenue | What It Means |
|---|---|---|
| Well-managed | 30-35% | Lean operations, strong admin efficiency |
| Typical | 35-40% | Room for improvement, but functional |
| Bloated | 40-45%+ | Overhead is eating margin — time to audit |
A company running 55% gross margin and 40% overhead lands at 15% net margin — solid. The same company with overhead creeping to 48% nets just 7%. The difference is often one unnecessary admin hire, a vehicle fleet that’s too large for current volume, or marketing spend with no tracked ROI.
Review every overhead line item quarterly. The question isn’t “do we need this?” — it’s “does this generate enough revenue or efficiency to justify its cost?”
Two operational metrics directly predict plumbing profit margins: revenue per plumber and billable hour efficiency.
Revenue per plumber targets for $1M-$10M plumbing companies fall in the $338,000-$380,000 range, depending on market and service mix. Companies heavy in new construction will run lower (volume-driven, thin margin). Service-dominant companies should hit the upper end. If you’re below $300K per plumber, you either have too many techs for your call volume or your pricing is too low.
Billable efficiency measures what percentage of a tech’s paid hours generate revenue. The industry average is a dismal 30%. That means for every eight hours you pay a plumber, fewer than three hours are billed to a customer. The rest is drive time, paperwork, callbacks, waiting between calls, and shop time.
Top-performing companies push billable efficiency to 50% or higher through:
Every percentage point of billable efficiency improvement on a 15-tech company translates to roughly $50,000-$75,000 in additional annual revenue without adding a single truck or tech.
If you ever plan to sell your plumbing company — or just want to know what it’s worth — your revenue mix matters more than your total revenue.
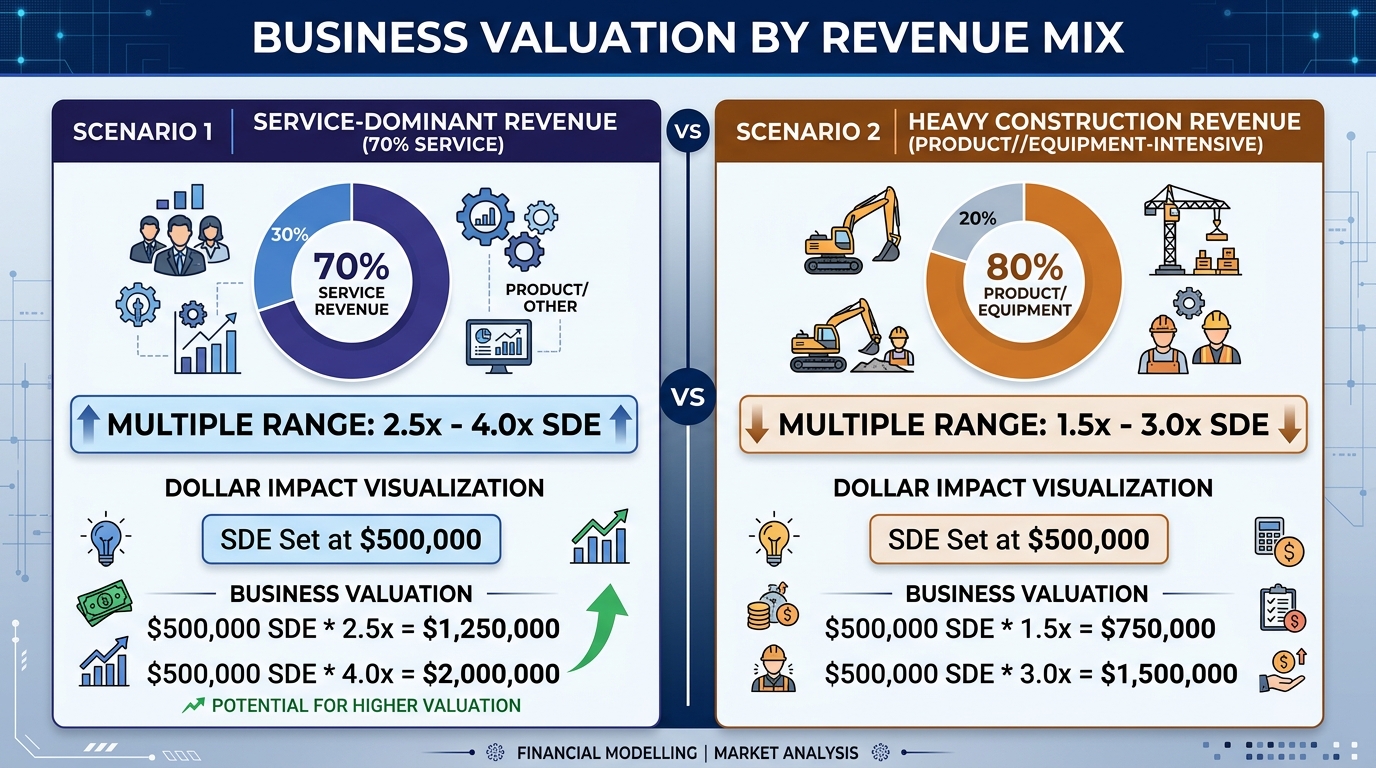
According to industry valuation benchmarks from Profitability Partners, plumbing companies trade at multiples of seller’s discretionary earnings (SDE). But the multiple varies dramatically based on what kind of work you do:
| Revenue Mix | Typical SDE Multiple | Why |
|---|---|---|
| 70%+ service/repair | 2.5-4.0x SDE | Recurring, high-margin, less owner-dependent |
| Balanced (service + remodel) | 2.0-3.0x SDE | Good margins but more project risk |
| Heavy new construction | 1.5-3.0x SDE | Low margins, relationship-dependent, volatile |
A service-dominant plumbing company with $400K SDE could be worth $1.0M-$1.6M. The same SDE from a new-construction-heavy company might fetch $600K-$1.2M. Revenue mix is the single biggest factor buyers evaluate, because it predicts margin stability and customer concentration risk.
This is why we recommend every plumbing contractor track revenue by class in QuickBooks — so you can see not just what you earned, but what kind of work generated it. Our plumbing contractor bookkeeping services set this up from day one.
The metrics above aren’t academic. They’re numbers your bookkeeper should be producing monthly. But only if your financial system is set up to segment revenue by service type, track labor by tier, and allocate overhead correctly.
Here’s what proper bookkeeping reveals that a basic P&L won’t:
Without this visibility, you’re making pricing decisions, hiring decisions, and growth decisions based on incomplete data. A plumbing company owner who knows their blended gross margin is 52% but can’t tell you their net margin on remodel work is operating on gut feel — and gut feel doesn’t scale past $2M.
Pro Tip: Ask your bookkeeper for a P&L broken out by service line (using QuickBooks Classes or Location tracking). If they can’t produce one, your financial system isn’t set up to manage plumbing profit margins — it’s just recording transactions.
Want to know exactly where your margins stand? Steph’s Books provides specialized bookkeeping for plumbing contractors — including monthly P&L by service type, truck stock reconciliation, and the margin benchmarks covered in this post. Get an instant quote or schedule a free consultation to see what we can do for your plumbing business.
Get a free quote and see how Steph's Books can save you 40-60% vs hiring in-house.