Your revenue report says you did $1.8 million last year. Your bank account says otherwise. The gap between what you bill and what you keep is hiding inside individual jobs — and without HVAC job costing, you have no way to find it. Most HVAC contractors we work with can tell you their total revenue to the penny. Almost none can tell you which job types are profitable and which ones are quietly draining margin every single week.
For the full picture of HVAC financial management, see our complete guide to HVAC bookkeeping. This post goes deeper on the job costing component specifically — the methodology, the math, and the QuickBooks setup that turns raw numbers into actionable data.
Job costing is the practice of tracking every dollar of cost — labor, materials, overhead — against a specific job, then comparing that total cost to the revenue that job generated. The result is a per-job profit margin that tells you exactly how much money you made (or lost) on that specific service call, installation, or maintenance visit.
This sounds simple. It is not. HVAC work involves multiple cost categories that behave differently depending on the job type, the technician assigned, the season, and whether anything went sideways on-site. A residential diagnostic that should take 45 minutes and cost you $65 can easily balloon to $180 when the tech spends an extra hour troubleshooting a misdiagnosed compressor issue and pulls a $40 part from the truck.
The contractors who build real wealth — the ones netting 12-15% instead of 3-5% — run job costing on every single ticket. Not quarterly. Not on big installs only. Every job, every week. The data compounds and patterns emerge within 60-90 days.
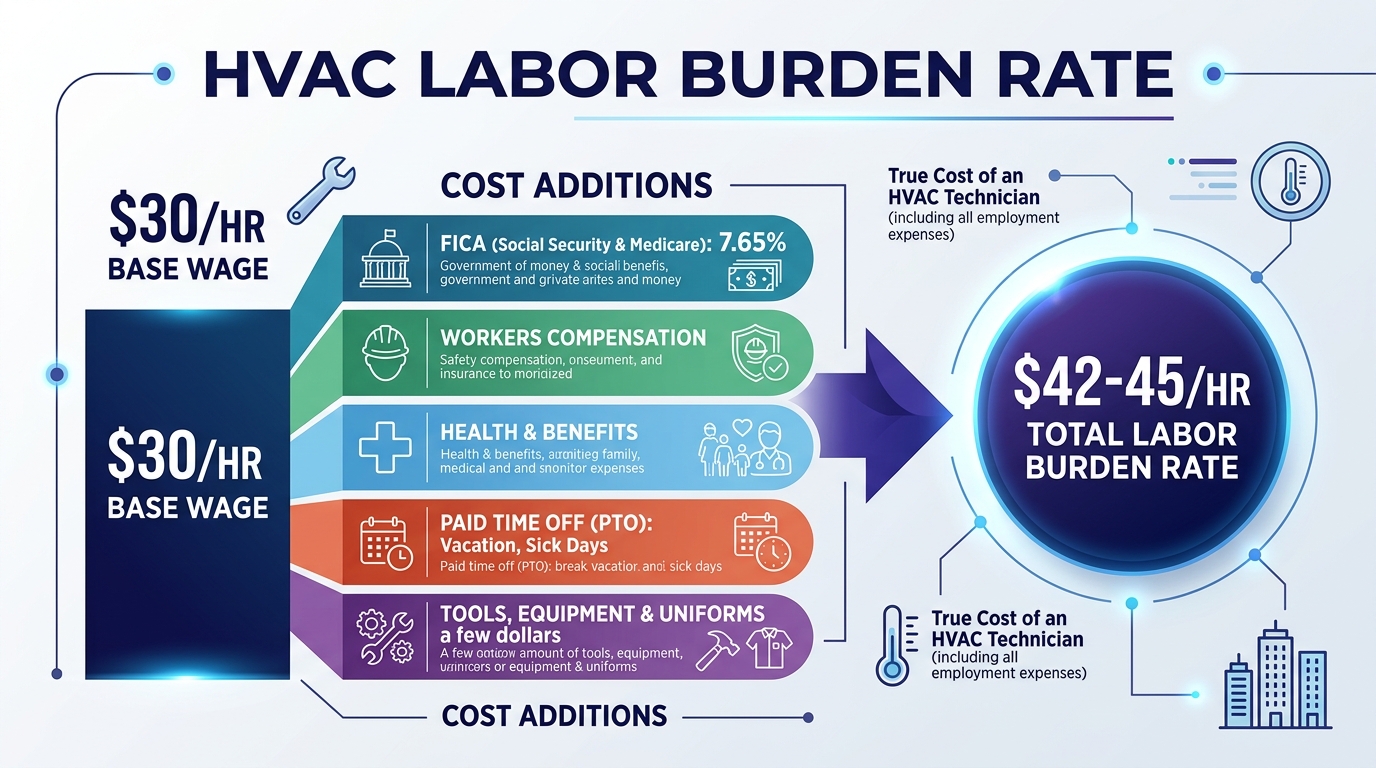
The most common job costing mistake in HVAC is using the technician’s hourly wage as the labor cost. Your tech earns $30/hr on the pay stub. Your actual cost for that tech is $42-$45/hr — and if you are not using the loaded number, every job looks more profitable than it actually is.
Here is the burden rate calculation for a typical HVAC service technician earning $30.00/hr:
| Cost Component | Rate / Amount | Per-Hour Cost |
|---|---|---|
| Base hourly wage | — | $30.00 |
| FICA (Social Security + Medicare) | 7.65% | $2.30 |
| Federal unemployment (FUTA) | 0.6% | $0.18 |
| State unemployment (SUTA) | ~3.0% | $0.90 |
| Workers’ compensation insurance | ~8-12% (HVAC trades) | $3.00 |
| Health insurance contribution | ~$500/mo ÷ 173 hrs | $2.89 |
| Paid time off (2 weeks) | 3.85% | $1.15 |
| Training & certification (EPA 608, NATE) | ~$300/yr ÷ 2,080 hrs | $0.14 |
| Fully loaded hourly cost | $40.56 – $44.56 |
The burden multiplier lands between 1.35x and 1.48x the base wage, depending on your benefits package and your state’s workers’ comp rates. HVAC workers’ comp is expensive — the Bureau of Labor Statistics classifies HVAC installation and repair as a physically demanding trade, and insurers price accordingly.
Use $42/hr (1.4x multiplier) as your default if you have not calculated your exact burden rate. It is close enough for job costing estimates and far better than using the $30 base wage. Once you know your actual insurance costs and benefit contributions, dial it in precisely.
Labor is half the equation. The other half — materials — requires its own tracking discipline because HVAC work pulls from three distinct cost pools:
Parts and supplies. Capacitors, contactors, fan motors, thermostats, filter driers, refrigerant. These are consumable items pulled from truck stock or warehouse inventory. Track each part used on each job, including the cost basis. If your tech installs a $22 capacitor from truck stock, that $22 needs to hit the job record — not sit in a generic “Parts Expense” line until month-end.
Refrigerant. R-410A and R-454B pricing fluctuates significantly. A pound of R-410A cost $8 in 2023 and $25+ in 2025 due to phase-down regulations. If you are not tracking refrigerant usage per job, you are undercosting every service call that involves a recharge. Log pounds used, not just “refrigerant charge — yes/no.”
Major equipment. Condensing units, air handlers, furnaces, mini-split systems. On installations, equipment is typically the single largest cost component — often 50-60% of total job cost. Track the actual purchase cost of the specific unit installed, not an average. A 3-ton Carrier condenser and a 3-ton Goodman condenser have very different cost bases, and using averages will distort your margin data.
Your field service platform — ServiceTitan, Housecall Pro, or Jobber — should capture parts and materials at the ticket level. The critical step is making sure that data flows accurately into your accounting system. A weekly reconciliation between your FSM parts report and your bookkeeping records catches discrepancies before they compound.
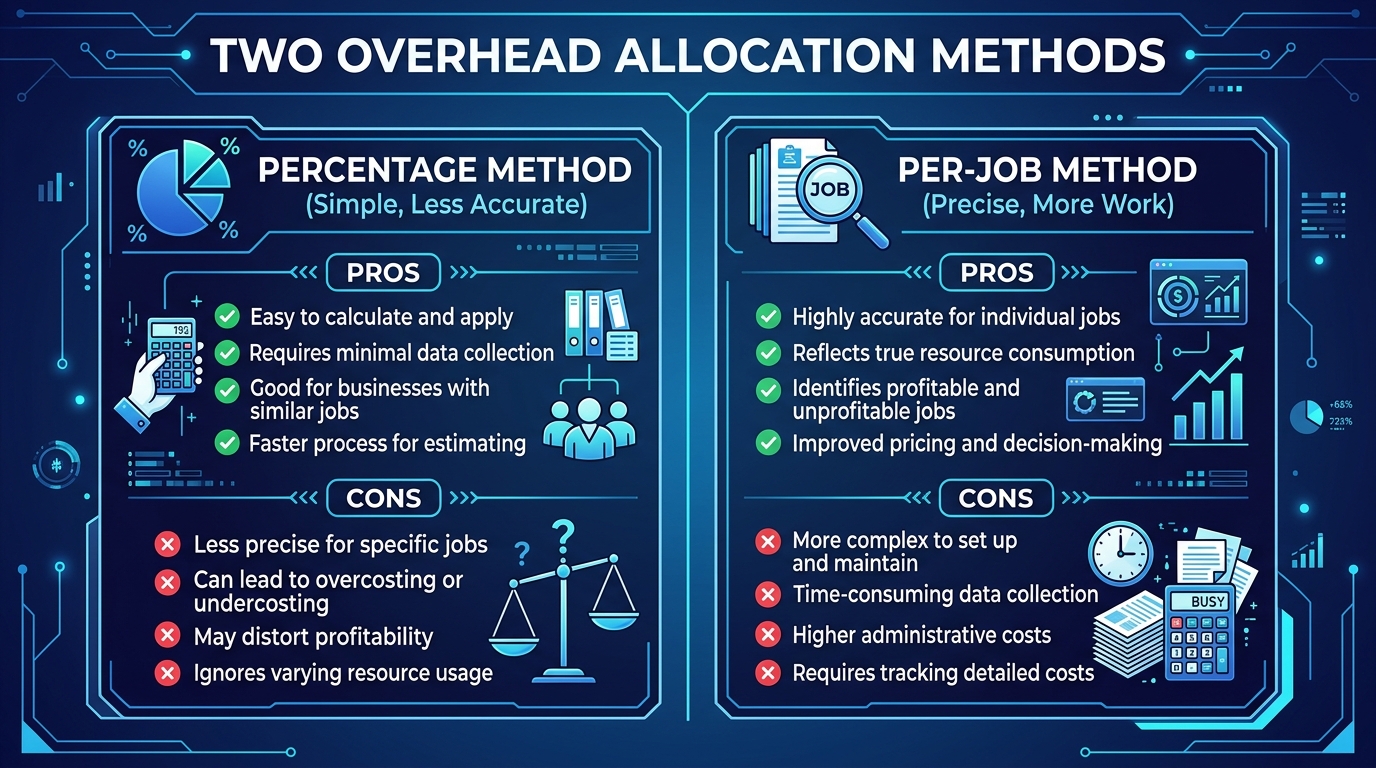
Direct costs (labor + materials) are straightforward to assign. Overhead — rent, insurance, truck costs, office staff, software subscriptions, marketing — is the harder piece. You need a method to allocate a fair share of overhead to each job so your margin calculations reflect reality.
There are two common approaches:
Apply a fixed percentage of the job’s revenue as overhead. Most HVAC contractors land between 10-15% of revenue as an overhead allocation rate.
Example: A $150 service call gets $15-$22.50 in allocated overhead. An $8,000 install gets $800-$1,200.
Pros: Simple. Easy to implement. Works well when job sizes are relatively consistent.
Cons: Penalizes high-revenue jobs. A $15,000 commercial install gets $1,500-$2,250 in overhead — but it may not actually consume more office resources than an $8,000 residential install.
Assign a flat dollar amount per dispatched job, regardless of revenue. Calculate this by dividing your total monthly overhead by the number of jobs completed.
Example: $45,000 monthly overhead ÷ 300 jobs = $150 per job.
Pros: More equitable for mixed job types. A $150 diagnostic and a $12,000 install both absorb $150 in overhead.
Cons: Requires accurate job count data. Fluctuates with seasonal volume (fewer jobs in shoulder months = higher per-job allocation).
Our recommendation: Use the percentage method at 12% of revenue as your starting point. It is simpler to implement in QuickBooks and accurate enough for most HVAC contractors between $1M and $5M. Above $5M, consider switching to activity-based costing where you allocate overhead by the actual resources each job consumes.
Job costing only clicks when you see the numbers side by side. Here are two real-world examples that illustrate why aggregate revenue data hides the truth.
A homeowner calls with a “no cool” complaint. Your tech drives 25 minutes, diagnoses a failed run capacitor, replaces it, and leaves. Total on-site time: 1 hour. You bill $150 for the diagnostic and repair.
| Cost Component | Amount |
|---|---|
| Technician labor: 1.5 hrs (incl. drive time) × $42/hr loaded | $63.00 |
| Truck roll (fuel, insurance, depreciation) | $28.00 |
| Parts: run capacitor | $18.00 |
| Dispatching & admin (CSR time, scheduling) | $22.00 |
| Overhead allocation (12% × $150) | $18.00 |
| Warranty callback reserve (2%) | $3.00 |
| Total job cost | $152.00 — $180.00 |
| Net margin | -$2 to -$30 (-1.3% to -20%) |
That job lost money. The $150 price tag did not cover the fully loaded cost of sending a technician to a residential address for a minor repair. If the tech hit traffic and the drive was 40 minutes instead of 25, you are deeper in the hole.
This is not necessarily a problem — if you know it is happening. Many HVAC companies treat basic service calls as loss leaders that generate upsell opportunities (maintenance agreements, system replacements, IAQ add-ons). The problem is when you do not track the loss and assume every dispatched job is profitable.
A homeowner needs a full system replacement — 3-ton split system, new thermostat, minor ductwork modification. You quote $8,000.
| Cost Component | Amount |
|---|---|
| Install crew labor: 2 techs × 8 hrs × $42/hr loaded | $672.00 |
| Equipment (condenser + air handler + thermostat) | $3,200.00 |
| Materials (line set, pad, disconnect, fittings, duct tape/mastic) | $380.00 |
| Permit fee | $125.00 |
| Overhead allocation (12% × $8,000) | $960.00 |
| Warranty reserve (2%) | $160.00 |
| Total job cost | $5,497.00 |
| Gross profit | $2,503 (31.3%) |
A 31-32% gross margin on a residential install is healthy. The Air Conditioning Contractors of America (ACCA) benchmarks suggest that well-run HVAC companies target 35-50% on installations. If you are consistently below 30%, your pricing is too low or your labor efficiency needs work.
Notice what changes the margin: if the install takes 10 hours instead of 8, labor jumps from $672 to $840 — a $168 hit that drops the margin to 29%. If you quoted a Carrier unit but installed a Trane at $200 more, margin drops another 2.5 points. Job costing catches these variances job by job, before they become invisible patterns that erode annual profitability.
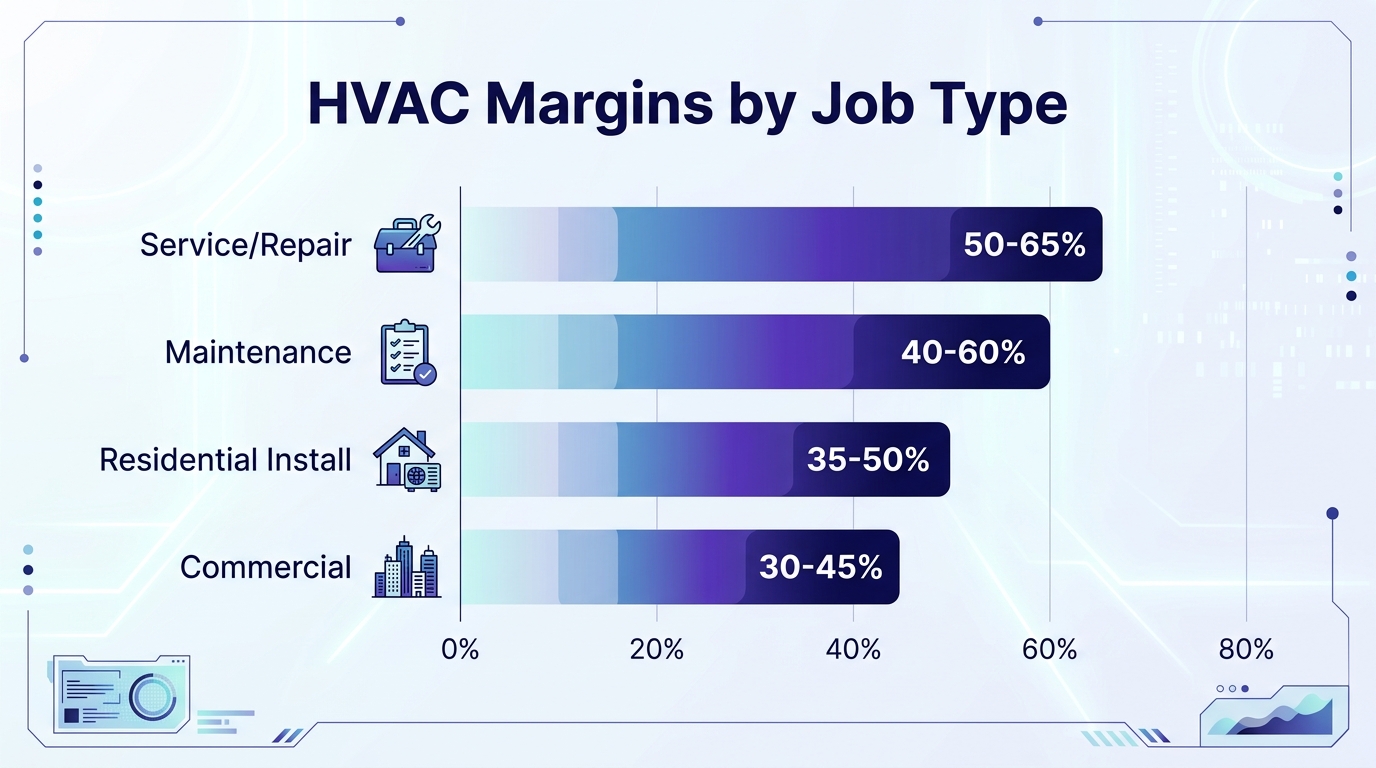
Once you have 90 days of job costing data, benchmark your margins against industry targets:
| Job Type | Target Gross Margin | Red Flag Threshold | Key Margin Driver |
|---|---|---|---|
| Service & repair calls | 50-65% | Below 45% | Tech efficiency + upsell rate |
| Maintenance agreements | 40-60% | Below 35% | Route density + renewal rate |
| Residential installs | 35-50% | Below 30% | Equipment cost + crew speed |
| Commercial installs | 30-45% | Below 25% | Scope accuracy + sub costs |
| New construction | 25-35% | Below 20% | Bid accuracy + change orders |
The pattern: Higher-complexity, higher-revenue jobs tend to carry lower margins but higher total gross profit dollars. A service call at 55% margin on $200 revenue generates $110 in gross profit. An install at 35% margin on $10,000 generates $3,500. You need both — but you need to know the actual numbers, not assumptions.
QuickBooks Online has a built-in Projects feature that maps well to HVAC job costing. Here is how to set it up:
Step 1: Enable Projects. Go to Settings > Account and Settings > Advanced > Projects and toggle it on. This unlocks the ability to create individual projects and assign transactions to them.
Step 2: Create a project for each job. Use a naming convention that includes the customer name, job type, and date: “Smith_Install_2026-04-02” or “Johnson_ServiceCall_2026-04-02.” Consistency matters — you will be filtering and reporting on these later.
Step 3: Assign all transactions. Every expense, bill, time entry, and invoice related to that job gets assigned to the project. This includes technician time (use QuickBooks time tracking or import from your FSM), parts purchased, equipment invoiced from your distributor, and subcontractor bills.
Step 4: Run the Project Profitability report. Navigate to Reports > Projects > Project Profitability. This shows revenue minus all assigned costs for each project. Sort by margin percentage to instantly identify your worst-performing and best-performing job types.
Step 5: Build custom reports by job type. Tag each project with a class or category (Service, Install, Maintenance, Commercial) so you can run margin reports by job type — not just individual jobs. This is where the strategic insights live.
For contractors using ServiceTitan or Housecall Pro, the FSM platform handles much of the on-job tracking. The critical integration point is making sure costs flow accurately into QuickBooks — see our guide on HVAC software and QuickBooks integration for the setup details.
The whole point of HVAC job costing is to inform better pricing. Once you have 90 days of per-job margin data, three patterns will emerge:
1. Service call pricing floor. Your data will show the minimum price at which a service call breaks even. If your average fully loaded service call costs $165 and you are charging $150, you either raise the diagnostic fee or restructure the call to include upsell opportunities that bring the blended margin positive.
2. Install pricing by complexity. Not all installs are equal. A straightforward changeout in an accessible attic is fundamentally different from a system relocation with new ductwork. Your job costing data will reveal the margin spread between simple and complex installs — and that spread should show up in your pricing tiers.
3. Maintenance agreement profitability. Maintenance agreements are supposed to be your highest-margin, most predictable revenue stream. If your job costing shows that your bi-annual tune-ups cost more to deliver than the agreement price justifies, your renewal price needs adjustment — or your technician time-per-visit is too high.
The pricing adjustment cycle: Review job costing margins quarterly. Compare actual margins to the benchmarks in the table above. Any job type consistently below the red flag threshold gets a pricing review, a process review, or both. This is how you move from guessing at prices to engineering them.
Need help setting up job costing and margin tracking for your HVAC business? Get an instant quote or schedule a consultation — we specialize in bookkeeping for trade contractors who want to know exactly where their money goes.
Ready to stop guessing which jobs make money? Steph’s Books provides dedicated bookkeeping for HVAC contractors — including job costing setup, margin tracking, and monthly reporting that shows profitability by job type. Get started today or try our instant quote tool to see what it costs.
Answer a few quick questions for an instant, no-obligation quote — no sales call required. See how Steph's Books saves you 40-60% vs. hiring in-house.