Most HVAC contractors can tell you their revenue within $10,000. Ask about their HVAC profit margins and you’ll get a pause, a shrug, or a number that came from their tax return nine months ago. That’s a problem — because in a trade where gross margins swing 30 points between job types and overhead can quietly consume 40% of revenue, knowing your margins in real time is the difference between building equity and building someone else’s wealth.
For the full picture of HVAC financial management, see our complete guide to HVAC bookkeeping.
This post lays out the specific HVAC profit margin benchmarks you should be hitting in 2026, breaks down where contractors actually lose money, and gives you five concrete strategies to move from the bottom quartile to the top. If you’re running a $1M-$10M HVAC company and you don’t know your net margin within two points right now, this is the most important thing you’ll read this week.
The table below consolidates benchmarks from the Department of Energy, Air Conditioning Contractors of America (ACCA), and Bureau of Labor Statistics data. These are targets for well-managed residential and light commercial HVAC companies between $1M and $10M in revenue.
| Metric | Poor | Average | Well-Run | Elite |
|---|---|---|---|---|
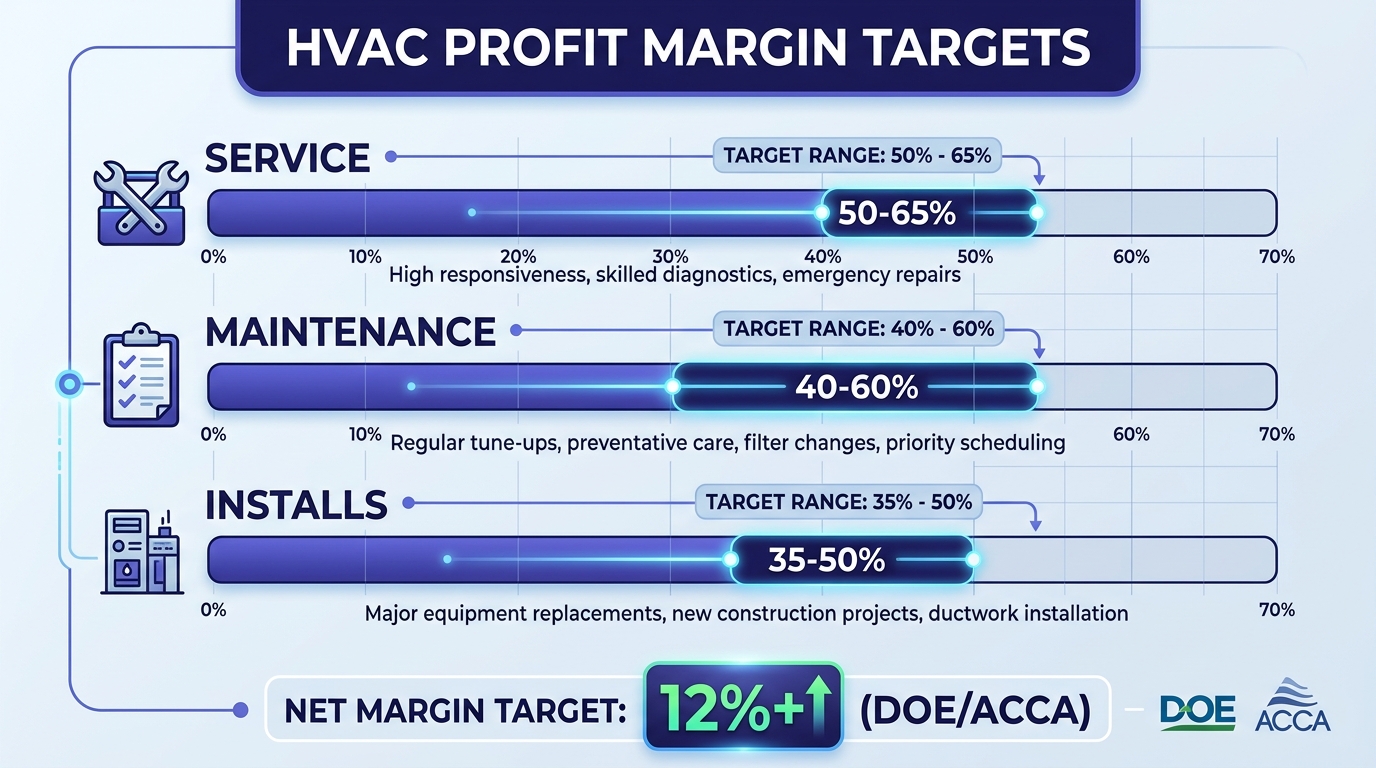
| Net profit margin | Below 5% | 5-8% | 10-15% | 15%+ |
| Gross margin — Service/Repair | Below 40% | 40-50% | 50-65% | 65%+ |
| Gross margin — Maintenance agreements | Below 35% | 35-45% | 40-60% | 60%+ |
| Gross margin — Installations | Below 30% | 30-38% | 35-50% | 50%+ |
| Revenue per technician | Below $120K | $120K-$180K | $150K-$250K | $250K-$450K |
| Overhead percentage | Above 40% | 30-40% | 20-30% | Below 20% |
| Billable efficiency | Below 60% | 60-70% | 70-80% | 80%+ |
| Warranty callback rate | Above 8% | 5-8% | 2-5% | Below 2% |
The 12% net margin target is the number ACCA has historically pointed to as a healthy floor for residential HVAC contractors. Anything below 8% means you’re one bad quarter away from cash flow trouble. Anything above 15% and you’re running an operationally excellent company.
Notice the massive spread in gross margins by job type. Service and repair work — diagnostic calls, compressor replacements, capacitor swaps — carries the highest margins (50-65%) because labor is the primary input and parts markup is substantial. Installations carry the lowest margins (35-50%) because equipment cost is a huge line item you can’t mark up as aggressively. This is why an HVAC company that shifts its revenue mix from 70% installs to a balanced split of installs, service, and maintenance agreements will almost always see net margin improve.
Numbers on a page don’t hit until you attach dollar signs. Here’s what the spread between a 5% net margin and a 15% net margin looks like for a $2 million HVAC company:
| 5% Net Margin | 15% Net Margin | |
|---|---|---|
| Annual revenue | $2,000,000 | $2,000,000 |
| Net profit | $100,000 | $300,000 |
| Monthly cash available | $8,333 | $25,000 |
| Owner’s draw (after reserves) | ~$60,000 | ~$180,000 |
That $200,000 difference is two new service trucks ($50K each, outfitted), two additional technicians (fully loaded), and a $40,000 marketing budget that funds your next $500K in growth. Or it’s a $200,000 gap in the owner’s retirement fund after ten years of compounding.
The 5% company is surviving. The 15% company is building enterprise value. Same revenue. Same market. Same number of cooling degree days. The difference is operational discipline — which starts with knowing your numbers at the job level, not the annual level.
Before we go further, let’s kill the most common financial confusion in the trades.
Gross margin is revenue minus direct job costs (technician labor, parts, equipment, subcontractors, permits). It tells you how profitable your work is before overhead.
Net margin is what’s left after you subtract everything — gross profit minus overhead (office staff, rent, insurance, marketing, fleet costs, software, owner’s salary). This is your actual profit.
Here’s why the distinction matters for HVAC contractors specifically: you can have a 55% gross margin on service calls and still net 4% if your overhead is bloated. An HVAC company running five trucks with two dispatchers, a full-time office manager, a $6,000/month shop lease, and $4,000/month in ServiceTitan and QuickBooks licenses can eat through a healthy gross margin fast.
The math: If your gross margin is 45% on $2M revenue, that’s $900,000 in gross profit. If overhead consumes $800,000 of that, your net profit is $100,000 — a 5% net margin on paper-healthy gross margins. The problem isn’t your pricing. It’s your overhead structure.
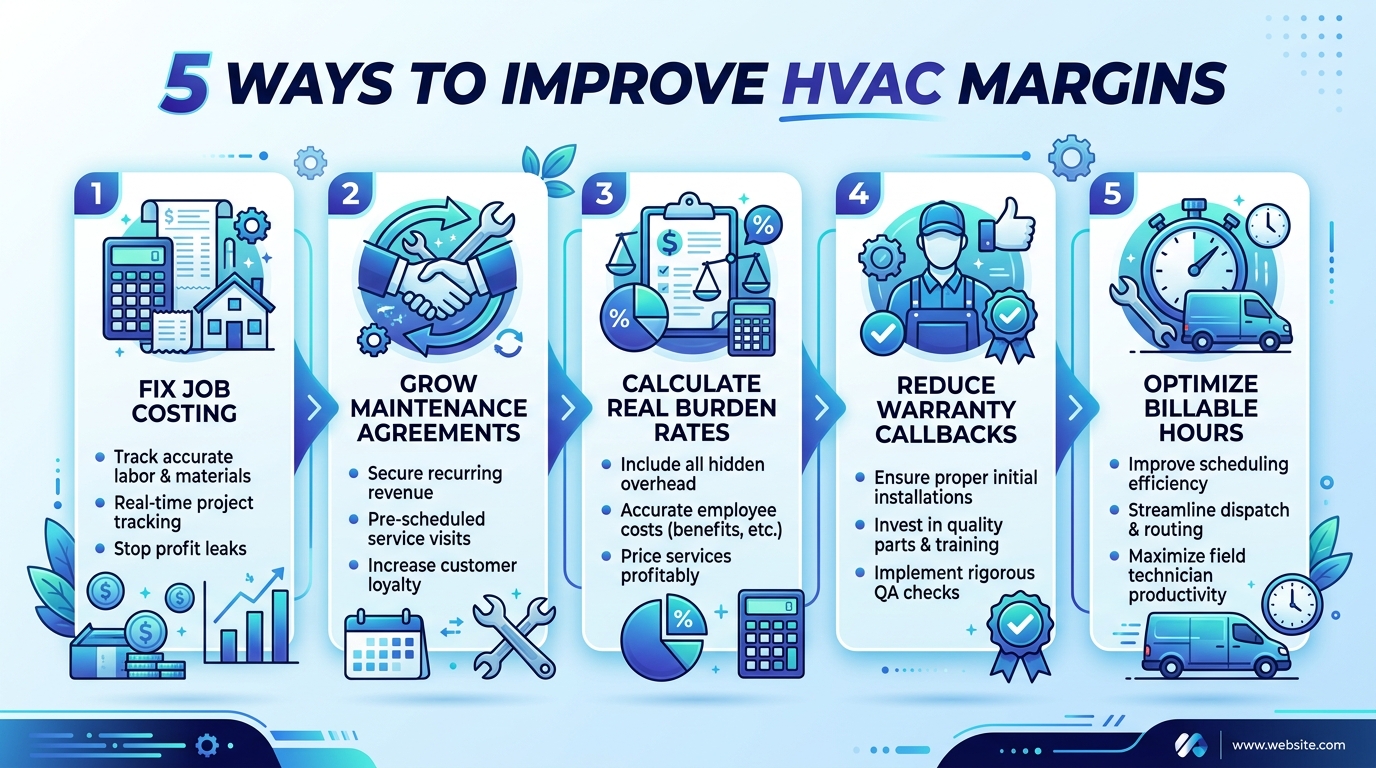
This is exactly why tracking HVAC job costing at the individual job level matters. You need to see gross margin by job type, by technician, and by month — so you can separate pricing problems from overhead problems.
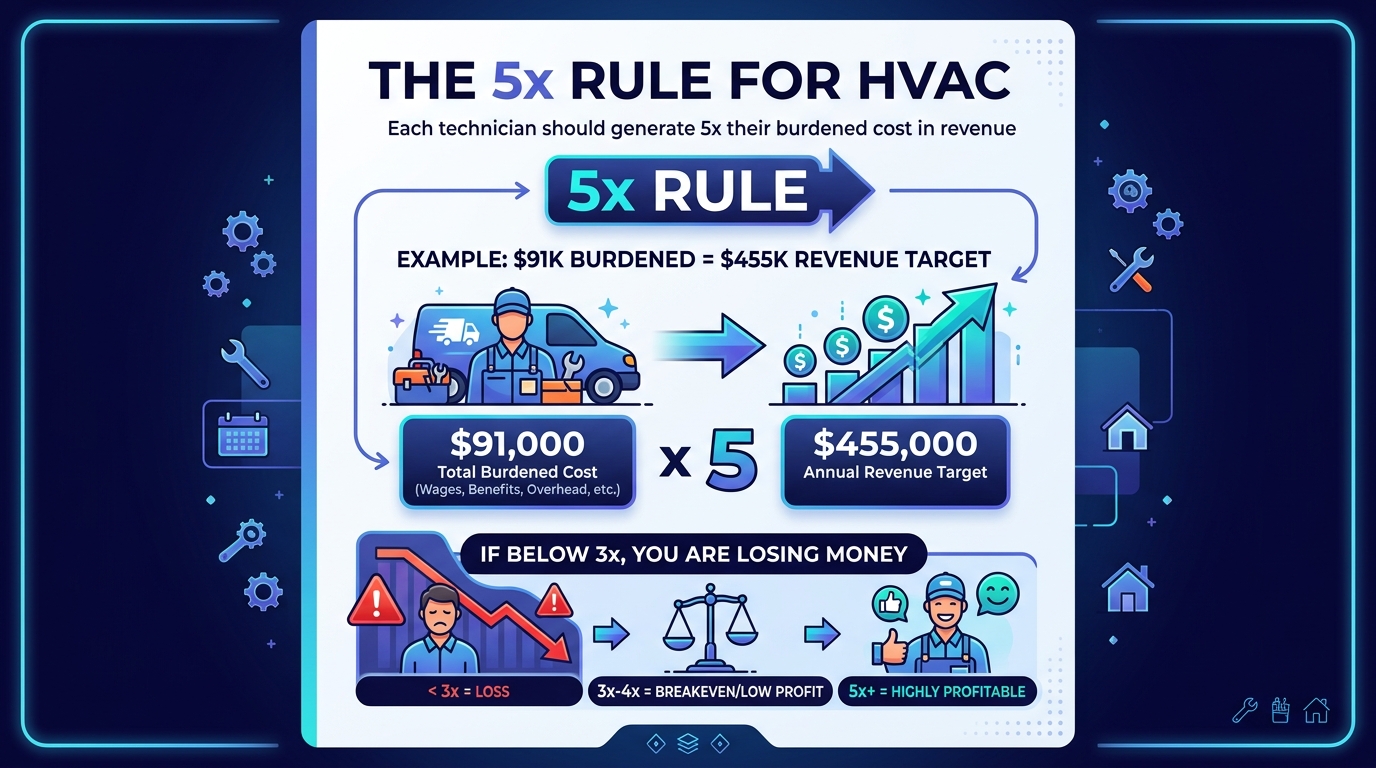
Revenue per technician is the single most diagnostic KPI for HVAC profitability. The benchmark is simple: each technician should generate 5x their total compensation in annual revenue.
A tech earning $65,000 in base pay with a fully burdened cost of $91,000 (adding benefits, payroll taxes, workers’ comp, vehicle costs, and tools) should be generating $325,000-$455,000 in revenue annually.
Here’s how the math breaks down:
| Metric | Underperforming | Average | High-Performing |
|---|---|---|---|
| Tech base pay | $55,000 | $65,000 | $75,000 |
| Fully burdened cost (base + 40%) | $77,000 | $91,000 | $105,000 |
| Revenue target (5x burden) | $385,000 | $455,000 | $525,000 |
| Revenue if generating 3x | $231,000 | $273,000 | $315,000 |
| Margin gap (3x vs 5x) | $154,000 | $182,000 | $210,000 |
When a tech generates only 3x their burdened cost instead of 5x, you’re leaving $150,000-$210,000 in potential revenue on the table per technician per year. Multiply that across a team of six techs and you’ve found your missing million.
The levers for improving revenue per tech are billable efficiency (percentage of paid hours that generate revenue) and average ticket size. A tech working 2,080 hours per year at 75% billable efficiency runs 1,560 billable hours. At an average ticket of $280, that’s $436,800 in revenue. Drop billable efficiency to 60% and the same tech generates $349,440 — a $87,360 difference from one metric.
For a deep dive into calculating true burdened costs for your techs, see our guide on HVAC technician payroll.
Overhead is every dollar you spend that isn’t directly tied to completing a job. Office rent, admin salaries, insurance, fleet costs, marketing, software subscriptions, licensing — all overhead.
The benchmarks:
The most common overhead trap for HVAC companies in the $1M-$3M range is premature infrastructure scaling. You hire a full-time dispatcher when call volume doesn’t justify it. You lease a 3,000 sq ft shop when 1,500 sq ft would work. You’re paying for ServiceTitan Enterprise when the Pro tier covers your needs.
Every $1,000 per month in unnecessary overhead costs you $12,000 per year in net profit. At a 10% net margin, you need $120,000 in additional revenue just to offset that one cost. That’s roughly 10 residential system installs — half a technician’s annual output.
You can’t improve margins you can’t measure. At minimum 20% of jobs at a typical HVAC company lose money — and the owner doesn’t know which ones. Set up job costing in QuickBooks or your field service platform that captures labor hours (not estimates — actuals), parts at true cost (not list price), burden allocation, and overhead allocation.
Run a job profitability report monthly. Sort by margin. The bottom 10% will show you patterns — certain job types, certain techs, certain zip codes, or certain equipment brands that consistently underperform. Fix the patterns, not the individual jobs.
Maintenance agreements are the highest-margin, most predictable revenue stream in HVAC. A $199/year residential maintenance agreement costs you roughly $80-$100 in technician time and parts for two tune-ups. That’s a 50-60% gross margin on recurring revenue you can count on every year.
Beyond the direct margin, maintenance agreement customers convert to repair and replacement work at 3-4x the rate of non-agreement customers. A base of 500 agreements at $199 each generates $99,500 in direct revenue plus an estimated $200,000-$300,000 in repair and replacement revenue from that captive customer base.
Every HVAC company should be targeting maintenance agreements at 20-30% of total revenue as a stabilizing force against seasonal swings.
Most HVAC owners price jobs using the tech’s hourly wage — $30/hour, $35/hour. But the real cost of that tech on a job site is 35-45% higher when you include:
A $30/hour tech actually costs you $42-$45/hour when fully burdened. If you’re pricing jobs at $30/hour labor cost, you’re underpricing every single job by 35-50% on the labor component. This is the number one reason HVAC contractors show healthy revenue and thin profit.
The Bureau of Labor Statistics data on HVAC service demand continues to grow, but warranty callbacks eat directly into that growth. Each warranty callback costs you $250-$500 in technician time, parts, and truck roll — with zero revenue to offset it.
At a 5% callback rate on 1,000 annual jobs, that’s 50 callbacks costing $12,500-$25,000 per year in pure margin destruction. Dropping to a 2% callback rate saves $7,500-$15,000 annually — straight to the bottom line.
Implement a post-installation quality checklist (refrigerant charge verification, airflow measurement, electrical connection torque checks) and track callbacks by technician. You’ll find that 80% of callbacks come from 20% of your team. That’s a training problem, not a systemic one.
Billable efficiency — the percentage of a tech’s paid hours that generate revenue — should be 70-80%. Most HVAC companies run at 55-65% because of windshield time (driving between calls), callbacks, parts runs, and administrative tasks.
Three high-impact fixes:
Moving billable efficiency from 60% to 75% on a team of six techs at $280 average ticket adds roughly $500,000 in annual revenue with zero additional headcount.
Even contractors who understand their benchmarks get blindsided by these margin leaks:
Untracked parts and materials. Techs pull a capacitor from the truck, replace it on a diagnostic call, and don’t log the part. At $15-$40 per part across hundreds of calls, that’s $5,000-$15,000 in annual inventory shrinkage that never shows up on a job cost report.
Underpriced emergency and after-hours calls. If your after-hours rate isn’t at least 1.5x your standard rate, you’re subsidizing overtime labor with standard-rate revenue. A tech earning time-and-a-half on a Saturday call costs you 50% more — your pricing needs to reflect that.
Warranty reserves not funded. When you don’t set aside 1-2% of job revenue into a warranty reserve, every callback hits current-month margins. This creates a seasonal distortion where Q1 margins look terrible because you’re absorbing warranty work from last summer’s installs.
Overhead misallocation. Spreading overhead evenly across all job types hides the truth. Your install division might be carrying 60% of overhead (because it uses the shop, the warehouse, and two admin staff for permitting) while your service division uses 20%. If you allocate 50/50, you’re overpricing service and underpricing installs.
For help getting these systems set up correctly, visit our HVAC contractor bookkeeping services page to see how we work with trade contractors specifically.
HVAC profit margins don’t improve because you raise prices 5% across the board. They improve because you can see — at the job level, by tech, by service type, by month — exactly where money is made and where it leaks. The benchmarks in this post give you the targets. Job costing gives you the visibility. And a bookkeeper who understands HVAC gives you the reports without you spending your weekends in QuickBooks.
If you’re not tracking gross margin by job type, revenue per technician, and overhead percentage as a ratio of revenue, you’re guessing. And guessing at $2M in revenue means guessing with $200,000.
Ready to see where your HVAC margins actually stand? Steph’s Books specializes in bookkeeping for HVAC and trade contractors. Get an instant quote or schedule a free consultation to find the profit hiding in your books.
Get a free quote and see how Steph's Books can save you 40-60% vs hiring in-house.