You ran 1,200 jobs last year. Your P&L says gross margin is 46%. But which jobs made money? The $350 service calls? The $18,000 bathroom remodel? The new construction project you bid at 12% margin that your gut says ended up closer to 5%? If your answer is “I don’t know,” you don’t have a plumbing job costing problem — you have a visibility problem. And it’s costing you somewhere between $40,000 and $200,000 a year in margin you can’t see, can’t measure, and can’t fix.
For the full picture of plumbing financial management, see our complete guide to plumbing bookkeeping. This post goes deep on one piece of that puzzle: how to set up job costing so that every service call, drain job, remodel, and new construction project tells you exactly what it earned — or lost.
Gross margin is a company-level metric. It tells you whether the business is healthy in aggregate. It does not tell you whether your drain cleaning division is subsidizing money-losing service calls, or whether your remodel crew is actually earning the 35% margin you quoted.
Plumbing companies run four fundamentally different businesses under one roof. Each has its own margin profile:
| Service Type | Typical Gross Margin | Key Cost Driver |
|---|---|---|
| Drain cleaning | 50-70% | Equipment amortization, low materials |
| Service & repair | 40-55% | Truck stock, tech efficiency, dispatch density |
| Remodel / renovation | 25-40% | Materials, subcontractors, change orders |
| New construction | 10-18% | Competitive bidding, long payment cycles, volume |
A company doing $4M with 60% service work and 20% drain cleaning will look profitable at the top line. But if the service division is sending master plumbers on $200 drain calls and nobody is tracking truck stock usage, the real margin on those 800 service calls could be 15 points lower than reported. That’s the gap job costing closes.
Key insight: The goal of plumbing job costing is not to create more paperwork. It’s to answer one question per job: “Did we make what we expected to make?” If you can answer that within 48 hours of job completion, you can fix pricing, staffing, and dispatch problems in real time — not at year-end.
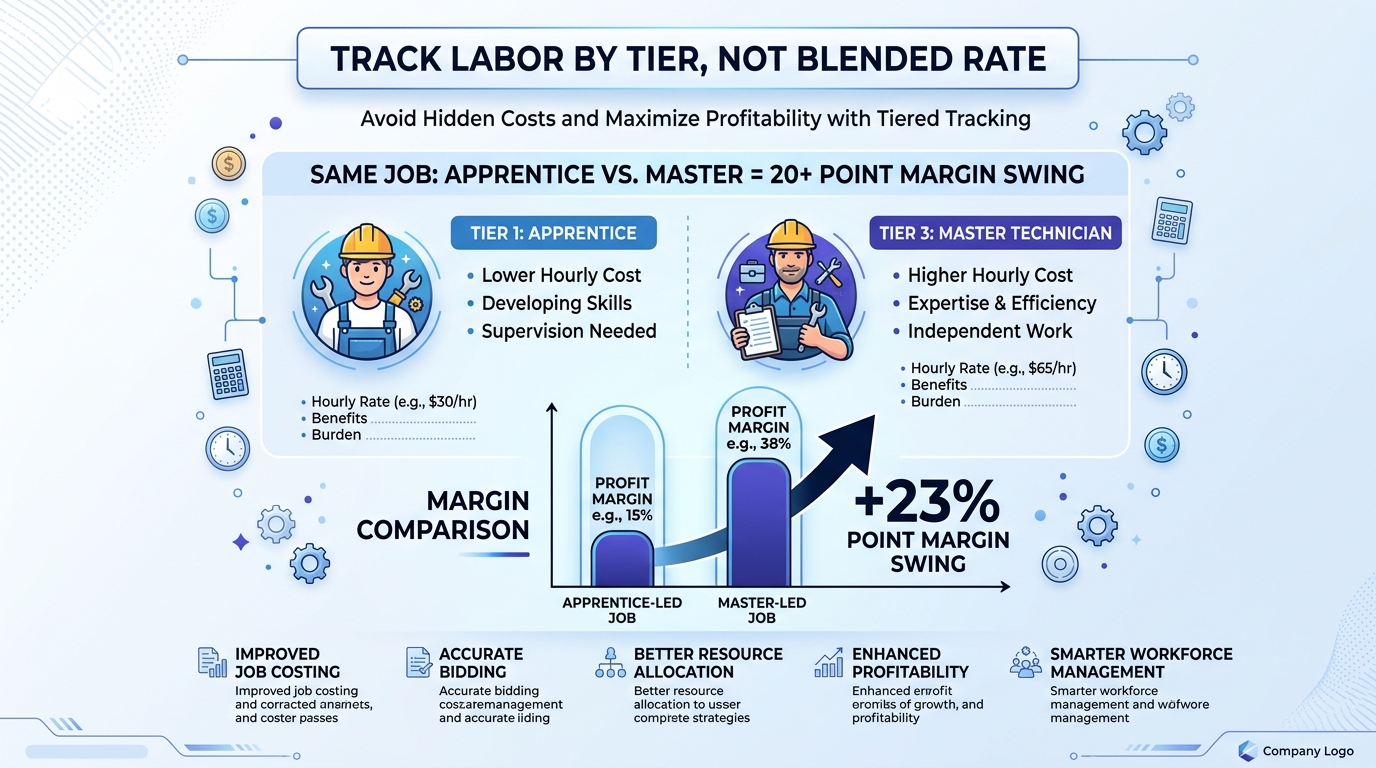
Labor is the single largest cost on most plumbing jobs, and it’s the one most contractors get wrong. The mistake is using a blended burden rate — averaging all your techs into a single hourly cost. That math hides the truth.
Here’s what labor actually costs by tier when you include wages, FICA, workers’ comp, health insurance, vehicle costs, and PTO:
| Labor Tier | Hourly Wage Range | Fully Loaded Cost/Hour |
|---|---|---|
| Apprentice (1-4 years) | $16-$28 | $27-$60 |
| Journeyman (5-10 years) | $28-$45 | $36-$120 |
| Master Plumber | $45-$75 | $100-$175 |
The Bureau of Labor Statistics reports median plumber wages at $30.46/hour nationally, but that blended number is useless for job costing. What matters is who you sent to the job.
Consider this scenario: A customer calls with a clogged kitchen drain. You dispatch your master plumber because he’s closest. The job takes 1.5 hours and bills at $350. Your master plumber’s loaded cost is $150/hour. That’s $225 in labor alone — before you count the truck roll, parts, or overhead allocation. Your “high-margin service call” just earned 36% gross margin instead of the 55% you’d get sending an apprentice-journeyman team.
Multiply that dispatch mistake across 10 calls per week, and you’re leaking $30,000-$50,000 per year in avoidable labor cost overruns. Plumbing job costing makes that visible. A blended rate hides it.
In QuickBooks Online, create separate Service items for each labor tier:
When your techs log hours against a job, they select the correct labor tier. This flows the actual labor cost to the project, not an average. If your field service platform (ServiceTitan, Housecall Pro, FieldEdge) syncs with QuickBooks, map the technician tiers in the integration settings so it happens automatically.
Parts and materials are the second-largest cost on most plumbing jobs, and truck stock is where the tracking falls apart.
Every service van carries $3,000-$8,000 in fittings, valves, connectors, and common repair parts. When a tech uses a $12 SharkBite fitting, a $45 ball valve, and a $23 wax ring on a service call, those costs need to hit the job. In practice, here’s what usually happens: the tech records the big-ticket items (a $280 water heater, a $150 faucet) and forgets the small stuff. The small stuff adds up to $60-$100 per call — and it never gets costed to the job.
This is the $80 in untracked parts problem. It shows up as a phantom gap between your quoted margin and your actual margin, and most plumbing contractors don’t realize it exists until they do a physical truck stock reconciliation and find $1,200-$3,000 in “missing” inventory per truck per quarter.
The reconciliation doesn’t need to be perfect. Even a rough monthly adjustment is dramatically better than letting truck stock shrinkage accumulate invisibly all year.
For parts purchased for a specific job (special-order fixtures, water heaters, sump pumps), use purchase orders in QuickBooks linked to the project. This creates a clean cost trail from vendor invoice to job P&L.
Mid-size plumbing companies regularly use subcontractors for specialized work:
Every subcontractor invoice needs to hit the specific job it was performed on — not a general “Subcontractor Expense” line. In QuickBooks, create bills against the sub and assign them to the relevant project. This is especially critical for remodel and new construction jobs where sub costs can represent 15-30% of total job cost.
The PHCC (Plumbing-Heating-Cooling Contractors Association) recommends tracking subcontractor costs as a separate COGS line item rather than rolling them into materials or labor. This gives you a clear view of how much of each job’s cost you control directly versus how much you’re outsourcing — and whether those subs are eating your margin.
Pro Tip: Collect W-9s from every subcontractor before their first payment, not in January when 1099s are due. Build it into your vendor onboarding process. Missing a 1099 filing carries an IRS penalty of $310 per form in 2026.
Direct costs (labor, materials, subs) are straightforward to assign. Overhead is where contractors struggle. Your shop rent, insurance, office staff, fleet costs, and software subscriptions benefit every job — but how much of that overhead should each job carry?
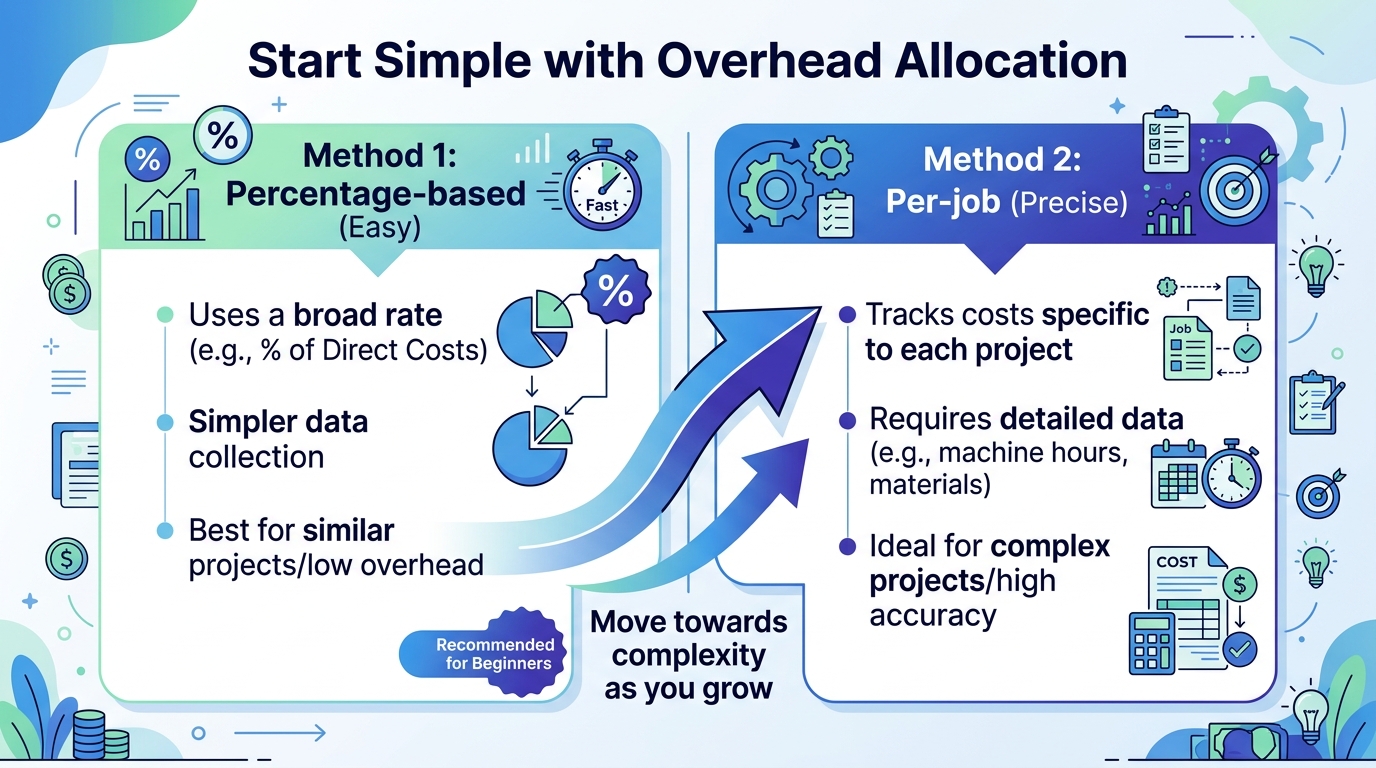
There are two common methods:
Take your total monthly overhead and divide it by total monthly revenue. If overhead is $45,000/month and revenue is $300,000/month, your overhead rate is 15%. Every job gets 15% of its revenue allocated as overhead cost.
Pros: Simple. Easy to calculate. Works well when your job mix is consistent.
Cons: A $350 service call and a $35,000 new construction project get the same percentage — but the service call uses one truck for 90 minutes, while the construction project uses three trucks for six weeks. The percentage method overcosts small jobs and undercosts large ones.
Assign overhead based on the resources each job actually consumed. Track truck-hours, labor-hours, or a composite metric per job. A service call that used 1.5 labor-hours gets a different overhead charge than a remodel that consumed 120 labor-hours.
Pros: More accurate. Reflects actual resource consumption. Better for companies with diverse job mixes.
Cons: Requires more data collection. Needs a reliable way to track labor-hours per job (which you should already have if you’re doing job costing correctly).
Our recommendation for most plumbing contractors between $1M-$5M: Start with percentage-based allocation. It’s better than no allocation. Once your bookkeeping system is tracking labor-hours per job reliably, graduate to per-job allocation for a more accurate picture.
Let’s trace a real job through the costing system. This is based on a composite of actual client data.
The job: Emergency kitchen sink backup. Customer pays $350.
What the dispatcher sees: A routine service call. High-margin work.
What the books show without job costing:
| Line Item | Amount |
|---|---|
| Revenue | $350 |
| Estimated COGS (company average 52%) | -$182 |
| Reported gross profit | $168 (48% margin) |
What job costing reveals:
| Cost Category | Amount |
|---|---|
| Revenue | $350 |
| Labor: Master plumber, 1.5 hrs @ $150/hr loaded | -$225 |
| Truck stock used (SharkBite fitting, P-trap, supply lines) | -$80 |
| Truck roll (fuel, wear, 22 miles round trip) | -$18 |
| Overhead allocation (1.5 labor-hrs @ $15/hr) | -$22.50 |
| Actual job cost | -$345.50 |
| Actual gross profit | $4.50 (1.3% margin) |
Reported margin: 48%. Actual margin: 1.3%. The difference comes from three sources: sending a master plumber instead of an apprentice-journeyman pair ($225 vs. ~$90 for two hours of apprentice labor), $80 in truck stock that was never logged, and $22.50 in overhead that was never allocated.
This single job isn’t a disaster. But if 20% of your service calls follow this pattern — wrong tech, untracked parts, no overhead allocation — you’re looking at a $60,000-$100,000 annual margin gap between what your P&L reports and what your bank account reflects.
This is the core argument for plumbing job costing: The numbers you report are only useful if they reflect reality. A 48% margin that’s actually 1.3% isn’t just inaccurate — it’s dangerous, because you’re making pricing and staffing decisions based on fiction.
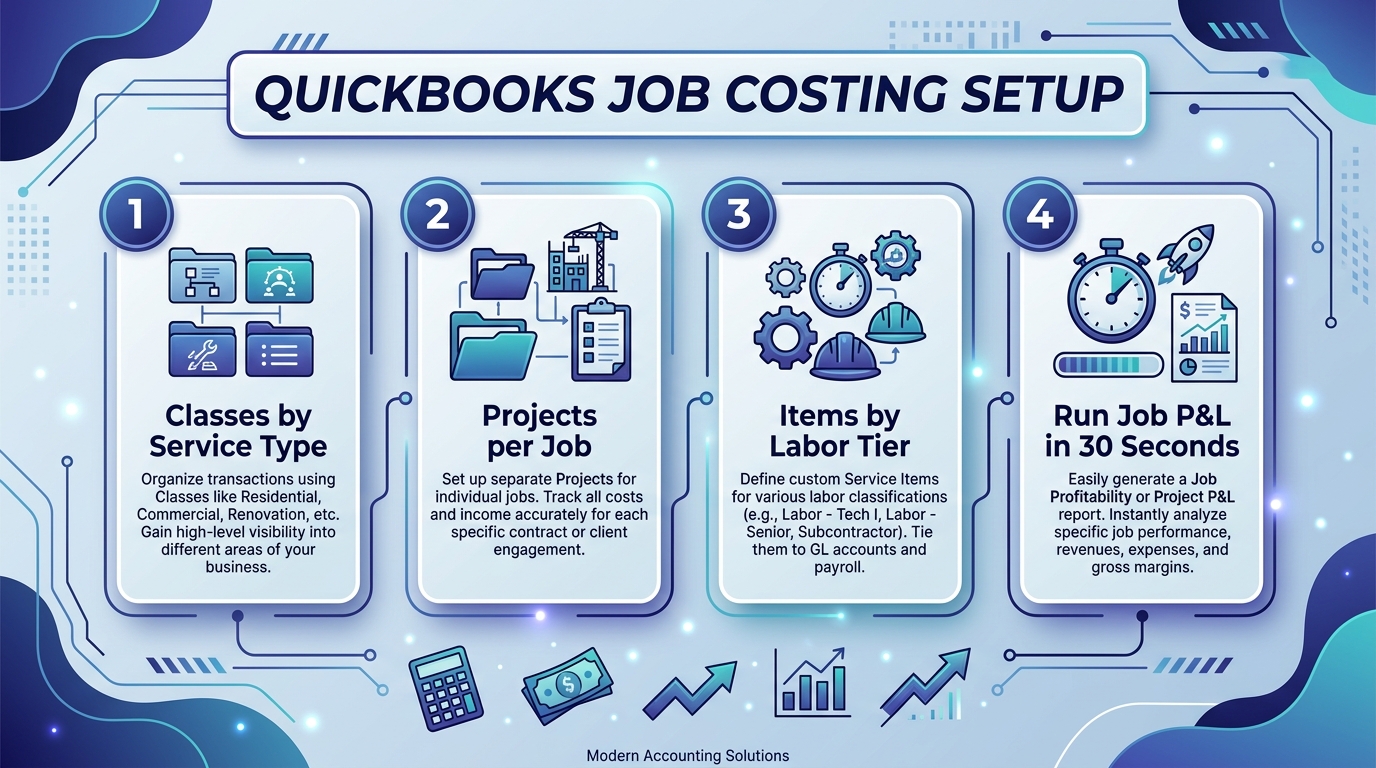
QuickBooks Online Plus or Advanced includes the Projects feature, which is the foundation for plumbing job costing. Here’s how to configure it:
Go to Settings > Account and Settings > Advanced > Categories and turn on Track classes. Create four classes:
Every transaction gets a class. This lets you run a P&L by service type — instantly showing which division is profitable and which is bleeding.
For service calls and drain cleaning, create a project for each job (or batch daily if volume is high). For remodel and new construction, every job gets its own project without exception. Link the customer, assign the class, and every invoice, bill, expense, and time entry for that job flows into its project P&L.
Create three service items under Products & Services:
When your techs log time, they select the correct item. The cost rate flows to the project, and you can see labor cost by tier on every job report.
For any material purchased for a specific job — water heaters, fixtures, specialty fittings — create a PO linked to the project. When the vendor bill arrives, match it to the PO. The cost hits the job automatically.
For truck stock, run a monthly reconciliation (see above) and journal-entry the variance across that truck’s completed jobs.
The point of plumbing job costing isn’t to create reports that sit in a drawer. It’s to feed a quarterly pricing review that adjusts your rates based on actual cost data — not gut feel, not what your competitor charges, not what you charged three years ago.
Here’s the cadence we recommend for plumbing contractors:
Monthly: Review job-level P&Ls for any job that came in under target margin. Identify the cause — wrong tech assignment, untracked materials, scope creep, or underbid.
Quarterly: Pull a profitability report by class (service type). Compare actual margins to your targets. If drain cleaning is hitting 62% but service calls are at 38%, you either need to raise service call rates, tighten dispatch rules, or both.
Annually: Recalculate your loaded labor rates with updated wage data, benefits costs, and workers’ comp rates. Update your burden rates in QuickBooks and adjust your pricing flat rates accordingly.
The companies that do this consistently — reviewing job cost data and adjusting pricing every quarter — typically see margin improvements of 3-5 percentage points within the first year. On $3M in revenue, that’s $90,000-$150,000 in additional gross profit from the same volume of work.
If you’re not sure whether your current plumbing profit margins are in line with industry benchmarks, start with the quarterly review. The data will tell you exactly where to focus.
The biggest reason plumbing contractors abandon job costing is that it feels like extra work. And it is — if you’re doing it manually. The key is building the system once and then letting integrations do the heavy lifting.
Your field service platform should sync labor hours and parts to QuickBooks. Your techs should be selecting labor tiers and logging parts in the field app, not on paper. Your office manager should be running a 30-minute weekly reconciliation, not a two-day monthly scramble.
If your current QuickBooks setup wasn’t built for job costing, it’s worth rebuilding the chart of accounts and project structure now. The cost of a one-time setup is trivial compared to running another year with margin data you can’t trust.
Ready to stop guessing which jobs make money? Steph’s Books specializes in bookkeeping for plumbing contractors — including job costing setup, QuickBooks configuration, and monthly financial reporting that shows profitability by service type. Get your free assessment and find out where your margins are really going.
Answer a few quick questions for an instant, no-obligation quote — no sales call required. See how Steph's Books saves you 40-60% vs. hiring in-house.