Your P&L statement is telling you what happened last month. Your business is happening right now.
That gap — between the historical record sitting in your accounting software and the actual state of your firm today — is where most professional services owners get into trouble. They schedule a monthly financial review, open QuickBooks, scan the income statement, and feel informed. They’re not. They’re looking at a photograph of a moving car.
The revenue on that report was generated by proposals sent six weeks ago, by clients retained three months ago, by a pipeline that was either healthy or anemic a quarter before that. By the time the P&L confirms a problem, you’ve already lived through it. You just didn’t know it yet.
This is the fundamental limitation of lagging indicators — and why every professional services firm operating between $1M and $10M in revenue needs to build a parallel system of leading indicators to manage the present and predict the future.
A lagging indicator is a metric that measures the outcome of decisions and activity that have already occurred. It confirms trends. It does not predict them.
The financial statements most professional services firms review fall almost entirely into this category:
None of this means lagging indicators are useless. Your P&L is essential for tax compliance, investor reporting, and historical trend analysis. The mistake is treating it as a management tool — as if reading last month’s score tells you how to win this week’s game.
The rearview mirror analogy: Lagging indicators are the rearview mirror. You need them to understand where you’ve been. But you cannot drive forward staring into the rearview mirror. Leading indicators are the windshield — they show you what’s coming.
A leading indicator is a metric that correlates with and predicts future performance. It measures activity and conditions that have not yet shown up in your financial statements but will — usually within 30 to 90 days.
Here are the leading indicators most relevant to professional services firms:
| Metric | Type | Lag to P&L Impact | What It Enables |
|---|---|---|---|
| Net income / profit margin | Lagging | Already happened | Historical analysis, tax planning |
| Monthly revenue | Lagging | Already happened | Trend review, goal tracking |
| Annual client retention rate | Lagging | 12 months | Benchmark against prior year |
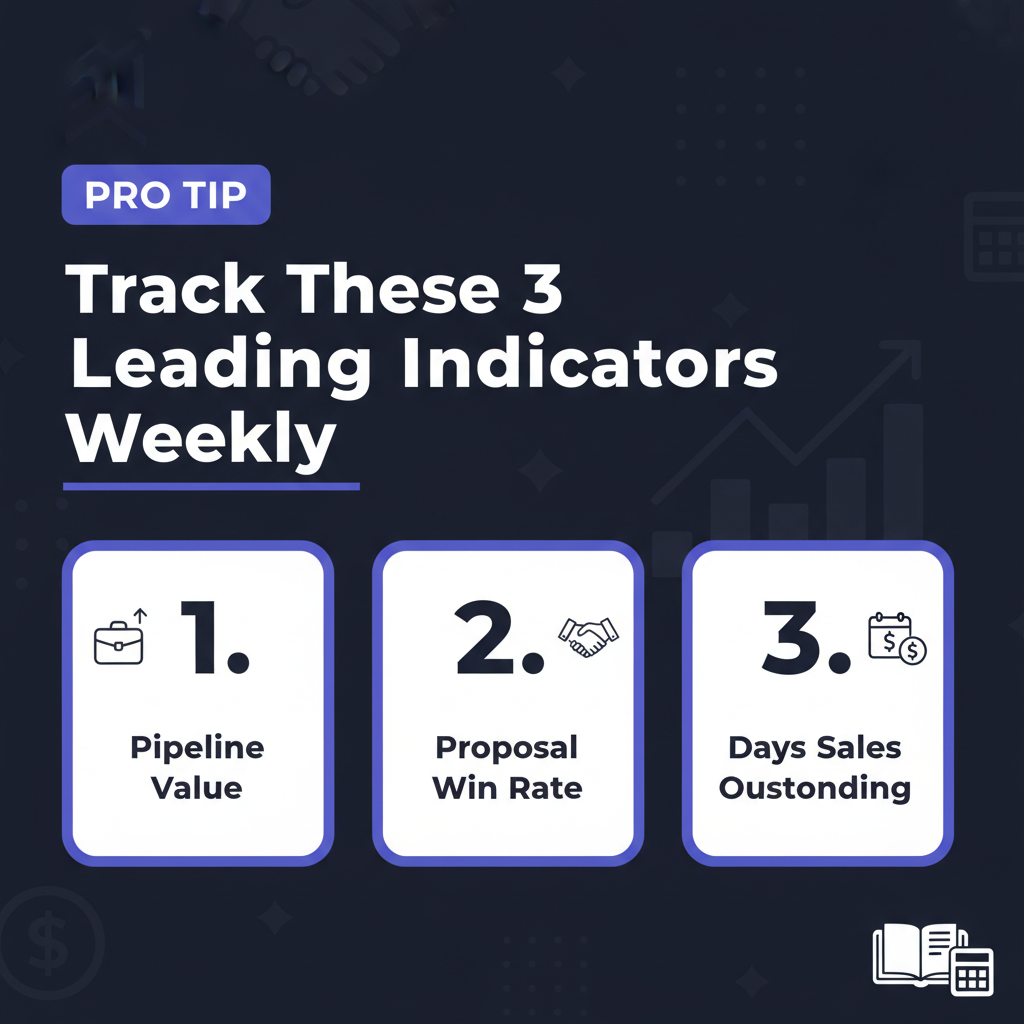
| Active pipeline value | Leading | 30–90 days | Revenue forecasting, staffing |
| Proposal win rate (trailing 90d) | Leading | 60–120 days | Pricing, positioning adjustments |
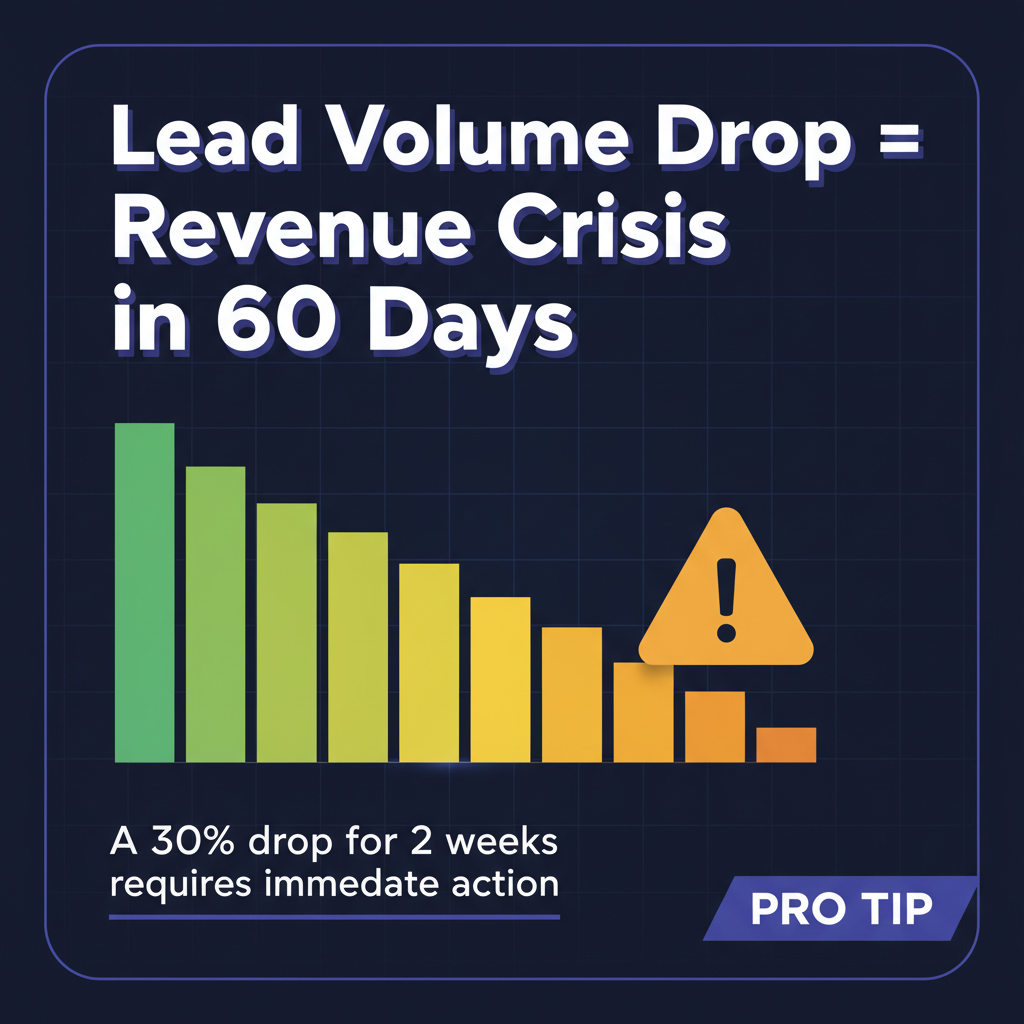
| New lead volume (weekly) | Leading | 30–90 days | Marketing investment decisions |
| Days Sales Outstanding | Leading | Current / 30 days | Collections action, cash flow |
| Staff capacity utilization | Leading | 30–60 days | Hiring, project allocation |
| Client satisfaction (NPS) | Leading | 60–180 days | Retention interventions |
| Onboarding completion rate | Leading | 30–90 days | Service delivery, churn prevention |
The total dollar value of all proposals and engagements currently in discussion. This is your single best 60-day revenue forecast. If your firm generates $200K/month and your pipeline sits at $180K, you have a revenue problem materializing next quarter — even if this month’s P&L looks fine.
How to track it: Every prospect gets logged in your CRM with estimated contract value and close probability. Pipeline value = sum of (estimated value × close probability) for all active opportunities.
Healthy target: Maintain a pipeline equal to 2–3× your monthly revenue target at all times.
A declining win rate is one of the most important early warning signals. It can signal price sensitivity, positioning problems, or a competitor gaining ground.
Healthy target: 35–55% win rate is typical for professional services; anything below 25% warrants investigation.
Not website visitors. Qualified leads — people who fit your target profile and have expressed genuine interest. When lead flow drops, it takes 4–8 weeks before that shows up in signed contracts.
Formula: (Accounts Receivable ÷ Total Credit Revenue) × Number of Days in Period
Healthy target: Under 45 days. Above 60 is a yellow flag. Above 75 is a cash flow emergency in waiting.
For law firms specifically, the law firm financial KPIs framework treats AR aging as one of the seven core metrics every managing partner should review monthly.
A quarterly NPS survey (“How likely are you to recommend us?”) gives you a real-time read on client sentiment that trailing retention data cannot.
Healthy target: NPS above 40 is strong. Below 20 is a warning. Any client scoring 6 or below is a retention risk.
Pro Tip: Don’t wait for the quarterly survey if you sense a problem. If a client has gone quiet — fewer emails, slower responses, questions about billing — that behavioral change is itself a leading indicator. Pick up the phone.
Track the percentage of new clients who complete all onboarding milestones within the first 30 days. If this rate is below 70%, you have a process problem seeding future churn.

Theory is useful. Implementation is what matters. Below are three complete, step-by-step walkthroughs showing exactly how to build one high-impact leading indicator from scratch — for a law firm, a property management company, and a consulting/agency firm. Follow these literally and you’ll have a working leading indicator within one week.
What it measures: The average number of days between initial consultation and signed engagement letter, tracked by practice area. This tells you how fast your pipeline converts — and where it’s slowing down before your revenue does.
Step 1 — Open a new spreadsheet. Create columns: Client Name, Practice Area, Consult Date, Engagement Signed Date, Days to Close, Retainer Value, Status (Won / Lost / Open).
Step 2 — Go back 90 days. Pull every consultation from your intake log, Clio, or calendar. Enter each one into the sheet. For signed clients, calculate days between consult and signed engagement. For lost prospects, mark them Lost with the date they declined. For open prospects, leave the signed date blank.
Step 3 — Calculate your baseline. Average the “Days to Close” for all Won matters. This is your current pipeline velocity. Break it out by practice area — personal injury conversions are typically faster than estate planning, for example.
Step 4 — Set thresholds.
Step 5 — Review every Friday. Takes 10 minutes. Look at the Open matters: how long have they been sitting? Which practice area is slowing? A matter that’s been open for 2× your average close time is likely dead — follow up or close it out.
What this predicts: If pipeline velocity slows by 25%, your signed engagement revenue will drop proportionally within 30–60 days. If it speeds up, you’ll see revenue lift. Either way, you know 30+ days before your P&L does.
What it measures: For every lease expiring in the next 90 days, a simple probability score (High / Medium / Low) predicting whether the tenant will renew. This tells you your vacancy risk — the single biggest leading indicator of property-level revenue.
Step 1 — Pull your lease expiration report. From AppFolio, Buildium, or your property management system, export every lease expiring in the next 90 days. Columns: Property, Unit, Tenant Name, Lease End Date, Monthly Rent, Renewal Probability, Notes.
Step 2 — Score each tenant. Assign High, Medium, or Low based on these signals:
| Signal | High (Likely Renews) | Medium (Uncertain) | Low (Likely Leaves) |
|---|---|---|---|
| Payment history | Pays on time every month | Occasional late (1–2x/yr) | Chronic late payer or disputes |
| Maintenance requests | Reasonable, satisfied with response | Increasing frequency | Unresolved complaints, angry tone |
| Communication | Responsive, positive interactions | Neutral or minimal | Hostile, threatening, or silent |
| Market rent vs. current | Current rent at or below market | Current rent at market | Current rent 10%+ above market |
| Lease term preference | Asked about renewal already | No indication either way | Mentioned moving or early termination |
Step 3 — Calculate your revenue at risk. Sum the monthly rent for all Low-probability tenants. Multiply by your average vacancy duration (typically 1–2 months). That’s your revenue risk for the next quarter. Add 50% of Medium-probability tenant rent as a secondary risk layer.
Step 4 — Act on it now. For every Low tenant: can you offer an incentive to renew? A rent freeze? An upgrade? The cost of a $50/month rent concession for 12 months ($600) is far less than one month of vacancy ($1,500–$2,500) plus turnover costs ($2,000–$5,000 in cleaning, repairs, and marketing). For Medium tenants: reach out personally before they start looking.
Step 5 — Review biweekly. Update scores as new information comes in. Track your prediction accuracy — after 90 days, compare your scores to actual outcomes and calibrate.
What this predicts: Vacancy rates and property-level revenue 60–90 days out. A P&L shows you last quarter’s vacancy loss after it’s already happened. This score tells you which units are at risk right now, with time to intervene. For more on property management financial operations, see our property management accounting guide.
What it measures: A composite score (1–10) for each active client, updated weekly, that predicts the likelihood of contract renewal or expansion — or churn. This is the single most predictive leading indicator for recurring-revenue consulting and agency firms.
Step 1 — Define your five scoring dimensions. Each scored 0–2:
| Dimension | Score 2 (Healthy) | Score 1 (At Risk) | Score 0 (Danger) |
|---|---|---|---|
| Engagement level | Client attends meetings, responds within 24h | Occasional no-shows, slow responses | Ghosting, skipped last 2+ meetings |
| Scope stability | Stable or expanding scope | Minor scope creep disputes | Scope reduction requests or “pause” language |
| Invoice behavior | Pays within terms every month | Pays 1–2 weeks late | Disputes invoices or 30+ days late |
| Satisfaction signals | Positive feedback, referrals | Neutral, no complaints | Complaints, escalations, competitor mentions |
| Champion stability | Primary contact is stable and empowered | Contact changed but new one is engaged | Champion left, no replacement introduced |
Step 2 — Score every active client. Open a spreadsheet: Client Name, Monthly Revenue, Contract End Date, and columns for each of the five dimensions. Score each dimension 0–2. Total score ranges from 0 (critical churn risk) to 10 (rock solid).
Step 3 — Set action thresholds.
Step 4 — Calculate revenue at risk. Sum the monthly revenue of every client scoring 4 or below. That’s your 60-day churn risk. If it exceeds 15% of your total recurring revenue, you have an urgent retention problem that will devastate next quarter’s P&L — but won’t show up on the P&L until it’s too late to fix.
Step 5 — Update every Monday morning. This takes 15–20 minutes for a firm with 15–30 active clients. The account manager for each client updates their scores based on the prior week’s interactions. In a weekly leadership standup, review any clients that dropped a point or more. One point drop = conversation. Two point drop = intervention.
What this predicts: Client churn 60–120 days before it appears on your income statement. More importantly, it gives you a specific, actionable window to fix the relationship. You can’t rescue a client who’s already sent a termination notice. You can rescue a client whose score just dropped from 7 to 5.
Here’s the uncomfortable truth: the quality of your leading indicator data is directly limited by the quality of your underlying bookkeeping.
When your books are 60 to 90 days behind:
This is why outsourced bookkeeping has become a strategic decision for growing firms. When a dedicated team closes your books within the first week of every month, every leading indicator downstream becomes more reliable.
According to the AICPA, firms that close books within seven days of month-end have measurably better cash flow management and faster response to anomalies.

| Week | Action | Owner | Time |
|---|---|---|---|
| Week 1–2 | Audit current tracking: what data exists in your CRM, PM software, and accounting platform? | Operations lead | 2–3 hours |
| Week 3–4 | Choose your 7 leading indicators. Define target, warning, and action thresholds for each. | Managing partner | 2 hours |
| Week 5–6 | Build the dashboard. Populate 90 days of historical data for baselines. | Operations lead | 4–6 hours |
| Week 7–8 | Assign metric owners. Train each owner on calculation and threshold responses. | Managing partner | 1–2 hours |
| Week 9–10 | Run first four weekly reviews. Refine based on what’s actionable vs. noise. | Leadership team | 15 min/week |
| Week 11–12 | Ensure bookkeeping closes by the 7th. Connect accounting data to dashboard. | Finance + bookkeeper | 2–3 hours |
By week 12, you have a functioning system. By month 6, you have enough data to spot meaningful trends. By month 12, you have a genuine competitive advantage over every peer firm still staring at a monthly P&L and calling it financial management.
Your P&L is not your enemy. It’s essential for tax compliance, reporting, and understanding the consequences of decisions you made 30 to 90 days ago. Review it every month.
But do not confuse reviewing it with managing your business. Managing means making decisions today that shape your P&L next quarter. That requires leading indicators — the metrics that measure the drivers of your future revenue, not the receipts from your past.
The most financially sophisticated firms aren’t running more complex models. They’re simply asking better questions each week: Is our pipeline healthy? Are we winning proposals? Is our team utilized? Are clients satisfied? Is cash collecting quickly?
They’re asking those questions before the P&L can tell them the answer. That’s the entire difference.
The windshield is bigger than the rearview mirror for a reason. Start using it.
Related Reading:
Ready to get your financial data current? Steph’s Books provides dedicated bookkeeping for professional services firms — monthly closes by the 7th, clean financials, and the data foundation your business driver dashboard needs. Schedule a free consultation →
Answer a few quick questions for an instant, no-obligation quote — no sales call required. See how Steph's Books saves you 40-60% vs. hiring in-house.